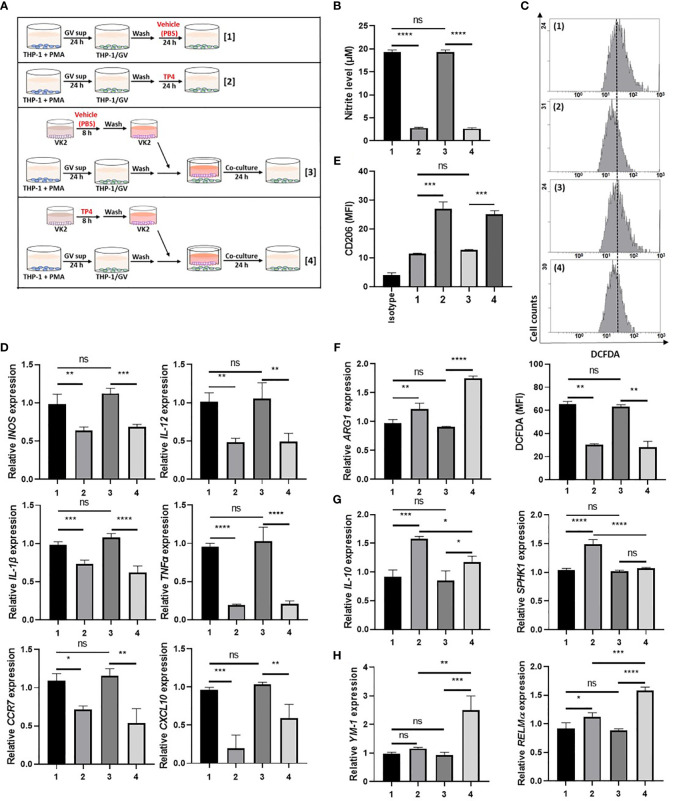
Figure 3.
TP4 induces M2 phenotypes in THP-1/GV cells. (A) Schematic description of the TP4 treatment methods for THP-1/GV cells. PMA (phorbol 12-myristate 13-acetate)-differentiated THP-1 cells were stimulated with 10% (v/v) G. vaginalis-free culture supernatants (GV sup) for 24 h. After incubation, THP-1/GV cells were washed with PBS and treated with [treatment 1] vehicle (PBS) or [treatment 2] TP4 (7.82 µg/ml) for 24 h or co-cultured with VK2 cells which had been pre-treated with [treatment 3] vehicle (PBS) or [treatment 4] TP4 (7.82 µg/ml) on cell culture inserts for 8 h and then replaced with fresh culture medium. (B) The nitric oxide (NO) levels in THP-1/GV cells were assayed by the NO assay. (C) The reactive oxygen species (ROS) levels in THP-1/GV cells were measured by the DCFDA assay using flow cytometry. The mean fluorescence intensity (MFI) is shown in bar graphs. (D) Gene expression levels of M1-related genes (INOS, IL-12, CCR7, CXCL10, TNFα, and IL-1β) were measured by qRT-PCR. Data were represented the normalized target gene amount relative to the group of treatment 1. (E) Macrophage surface marker (CD206) was detected by flow cytometry; the MFI is shown. The black bar graph indicates isotype controls. (F) ARG1 expression was measured by qRT-PCR. Data were represented the normalized target gene amount relative to the group of treatment 1. (G) Gene expression levels of M2c-related genes (IL-10 and SPHK1) were measured by qRT-PCR. Data were represented the normalized target gene amount relative to the group of treatment 1. (H) Gene expression levels of M2a-related genes (YM-1 and RELMα) were measured by qRT-PCR. Data were represented the normalized target gene amount relative to the group of treatment 1. Data are presented as mean ± SD of three independent experiments (*P < 0.05; **P < 0.01; ***P < 0.001; ****P < 0.0001; ns, not statistically significant).

