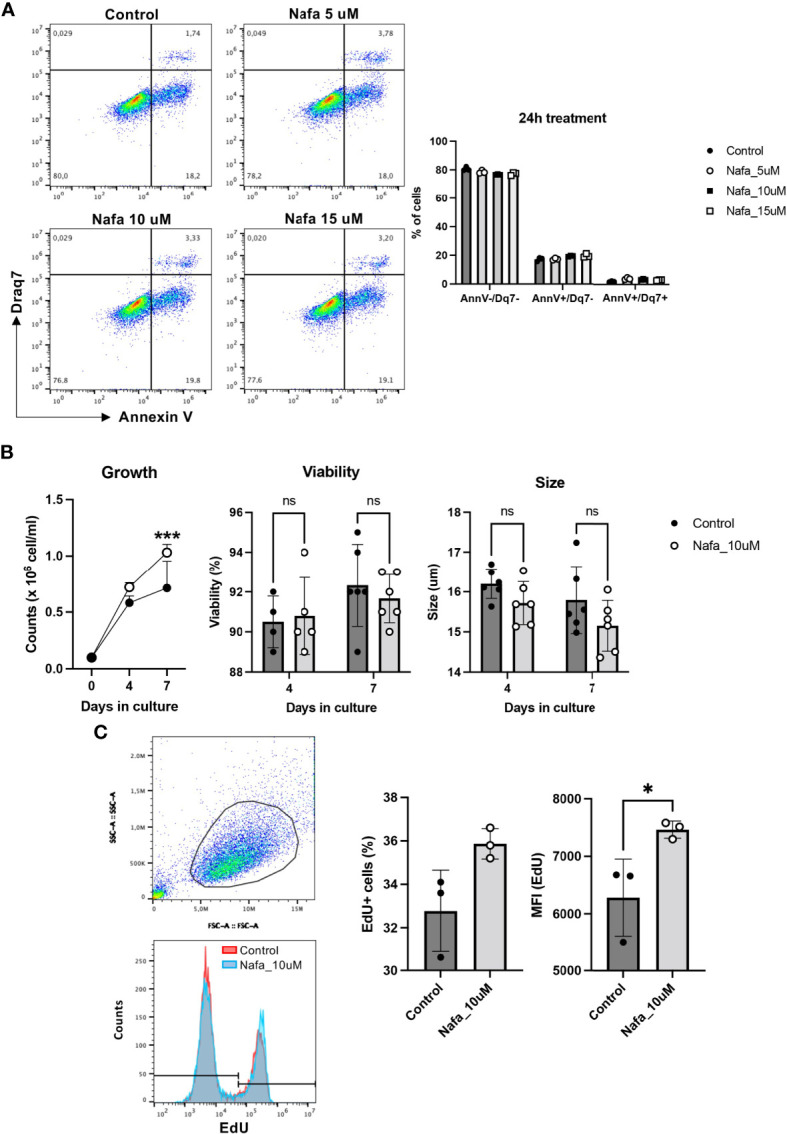
Figure 7.

Nafamostat increases proliferation of HMC-1 cells. HMC-1 (0.1 x 10⁶ cell/ml) were left untreated or cultured in presence of nafamostat. (A) Flow cytometry analysis showing representative dot plots and cell viability of HMC-1 cells after 24h treatment with different concentrations of nafamostat; quantification is shown in the right panel. (B) Cell counts in control cultures and in cultures containing 10 μM nafamostat. Note the increase in cell numbers when cells are cultured in the presence of nafamostat. No effect of nafamostat was seen on cell viability as measured by trypan-blue staining or on cell size. (C) Cells were assessed for proliferation by EdU staining and flow cytometry analysis. Representative dot blot shows gated alive cells (upper left panel) and merged representative histograms for the EdU staining (left lower panel). Quantification of the EdU staining as % EdU+ cells and mean fluorescence intensity (MFI) is depicted in the right panel. Data are represented as mean values ± SEM and analyzed with 2-way ANOVA and unpaired t test. *p ≤ 0.05, ***p ≤ 0.0001. ns, not significant.
