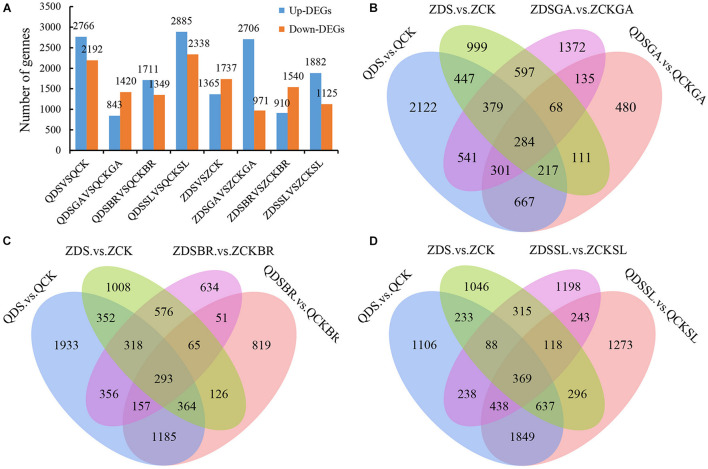
FIGURE 3.
Analysis of DEGs under different comparison groups. (A) The distribution of the number of DEGs in different comparison groups; (B–D) Venn diagram analysis of normal sowing depth, deep sowing stress and adding exogenous GA3, BR, and SL and normal sowing depth and deep sowing stress, respectively.

