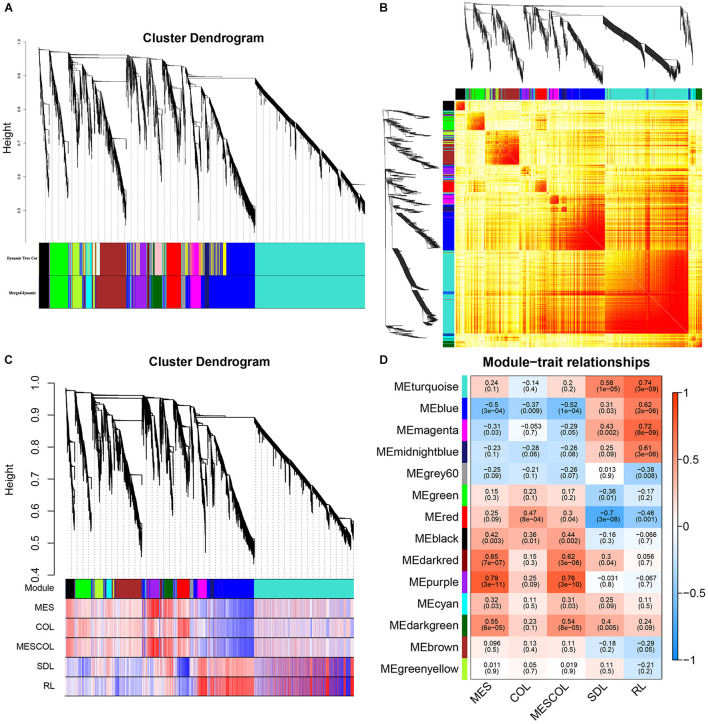
FIGURE 5.
Gene cluster analysis and correlation analysis between phenotype and module. (A) Hierarchical clustering analysis of co-expression genes. (B) Correlated heat maps between modules. (C) Correlation between gene module and phenotype. (D) Heat map of correlation between gene module and phenotype.

