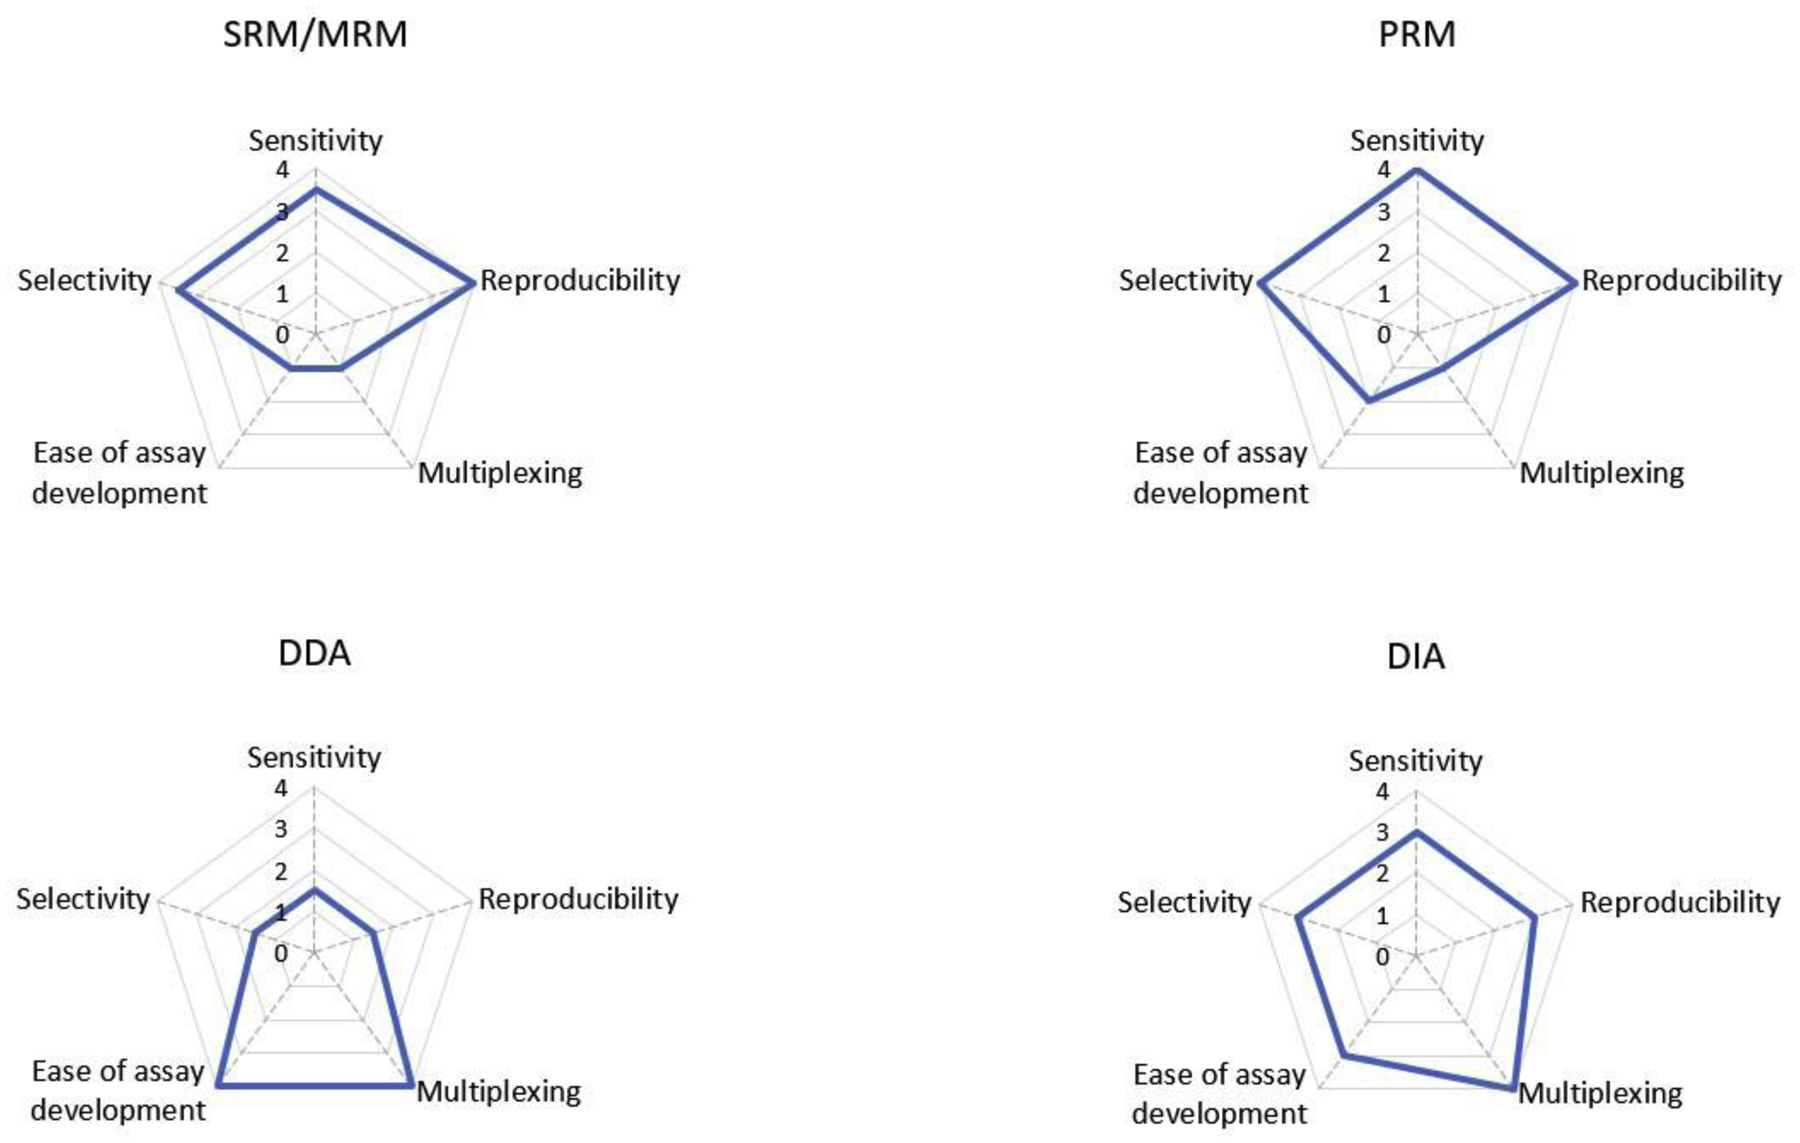
Figure 2.

Performance profiles of SRM, PRM, DDA, and DIA. The radar graphs depict the performance of the four methods regarding selectivity, sensitivity, reproducibility, multiplexing, ease of assay development. The highest value “four” indicates top performance, whereas “0” indicates the worst performance.
