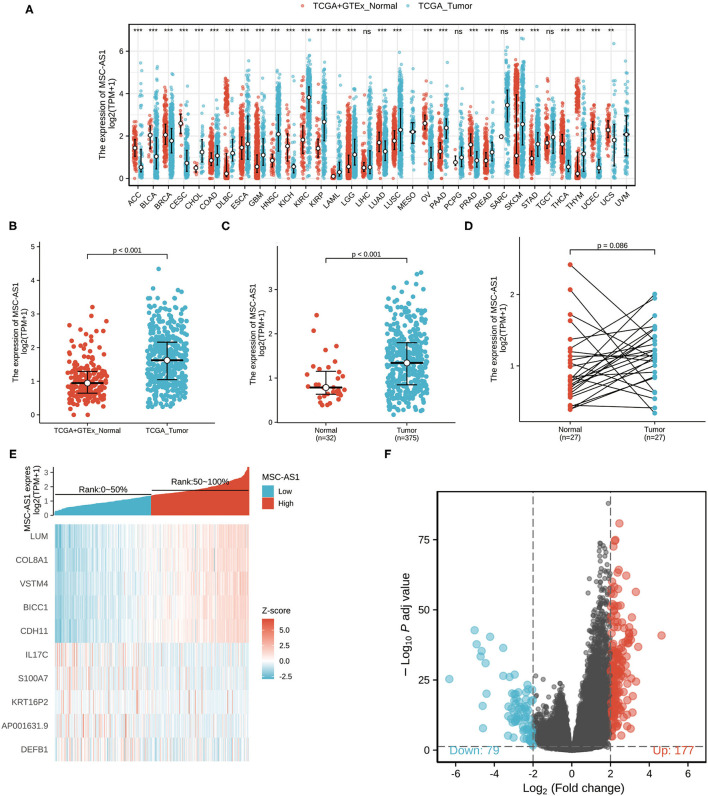
Figure 1.
The expression of long non-coding RNA MSC-AS1 in (A) in Genotype-Tissue Expression (GTEx) and normal The Cancer Genome Atlas (TCGA) samples with corresponding TCGA tumor samples; (B) in GTEx and normal TCGA samples with TCGA gastric cancer gastric cancer (STAD) samples; (C) in 375 gastric cancer tissues and 32 normal tissues in TCGA database; and (D) in 27 pairs of gastric cancer tissues and non-cancerous adjacent tissues in TCGA database; (E) Volcano plot of differentially expressed long non-coding RNAs (lncRNAs). Normalized expression levels are shown in descending order from green to red. There 177 differential molecules had log2FC > 2 and adjusted p < 0.05, and 79 differential molecules had log2FC < −2 and adjusted p < 0.05. (F) Heat map of the 10 differentially expressed long non-coding RNAs (lncRNAs). The X-axis represents the expression of lncRNA MSC-AS1, while the Y-axis denotes different the differentially expressed lncRNAs. Green and red tones represent downregulated and upregulated lncRNAs, respectively.

