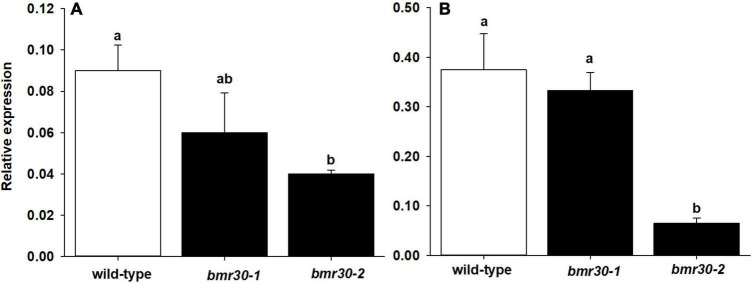
FIGURE 2.
Relative expression levels of CHI in (A) leaf and (B) stalk tissue of wild-type, bmr30-1, and bmr30-2 plants determined using RT-qPCR. Relative expression was determined using the ΔCt method with the α-tubulin transcript (Sobic.001G1070200.1) for normalization. Error bars represent standard error. Samples with different letters are statistically different at α ≤ 0.05 using Tukey’s HSD test.

