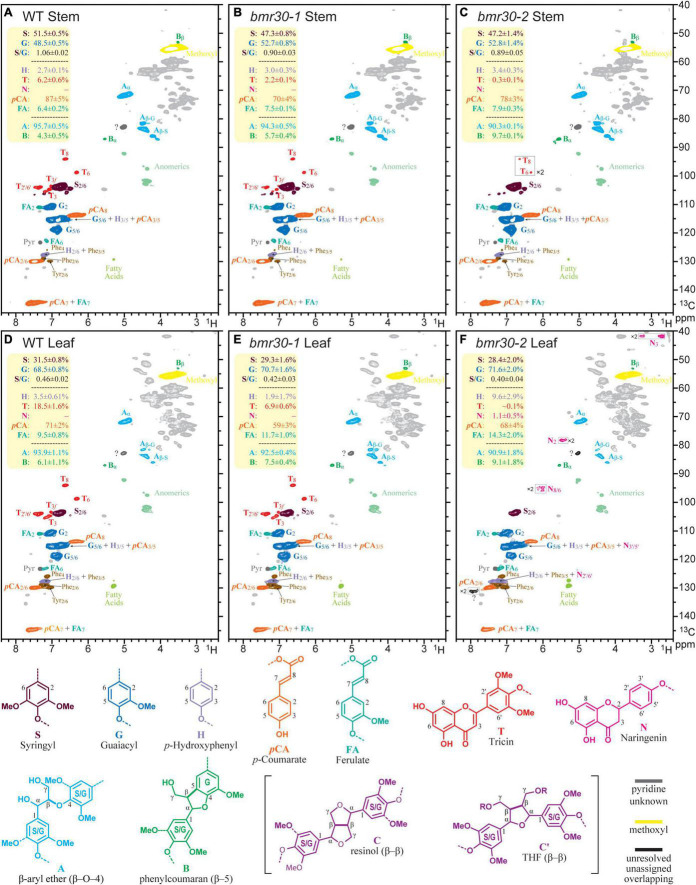
FIGURE 9.
Partial 2D HSQC NMR spectra (in 4:1 DMSO-d6/pyridine-d5) of the enzyme lignin (EL) preparations isolated from the wild-type and bmr30 lines. (A–C) Spectra of ELs from the stems of wild type (WT), and the bmr30-1, and bmr30-2 mutants. (D–F) Analogous spectra from the leaf ELs. Each plotted spectrum is a representative from a set of 4 biological replicates for each; the integral data in the top-left yellow-backgrounded panel of each presents the average and standard deviation from the analysis of all 4 replicates of each line, for a total of 24 samples. The main structural features are, where resolved, colored to match the structures below; no attempt is made to individually color the more minor components in overlapping peaks. The T denotes the tricin peaks, and N the naringenin peaks. Volume integration was used to determine the relative abundances of the G and S lignin units (and the S/G ratio); the other aromatic units including the H, p-coumarate (pCA), ferulate (FA), tricin (T), and naringenin (N) are reported on an S + G = 100% basis. The H-levels are not reliable because of the overlap with significant phenylalanine (Phe) peaks from proteins, particularly in the leaves, but are corrected by subtracting the volume of the Phe2/6 from the volume of the H + Phe3/5 peak. Only two of the lignin sidechain structures, characterized by their inter-unit linkages (A, B), were readily determined here, and are expressed as fractions of the sum A + B = 100%. The β-ether content in these samples are not considered to be over 90% of all total units. Resinols C (see structures below) were found at low contour levels (not shown), and the correlation peak labeled? is where the major tetrahydrofuran peak occurs. However, the β and γ correlations were not evident (even from TOCSY-HSQC spectra, not shown), so the large peak here is overlapped by another unknown peak; therefore, measurement was not attempted. As previously noted (Mansfield et al., 2012; Abu-Omar et al., 2021), endgroup units such as T and pCA, are over-represented in these spectra, but the relative levels remain useful for comparisons.

