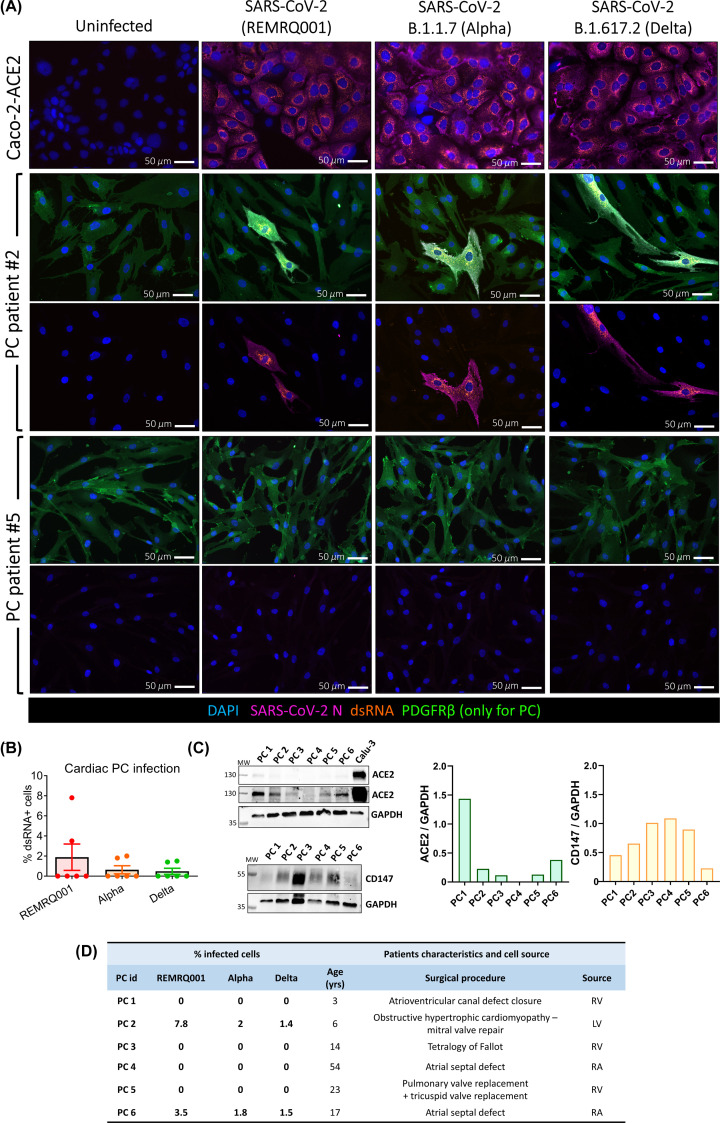
Figure 3. Infection of cardiac PCs by SARS-CoV-2 is a rare event in vitro.
Primary cardiac PCs (n=6 patients) and the Caco-2-ACE2 cell line were either mock-infected or inoculated with SARS-CoV-2 isolated early in the pandemic (REMRQ001) or the α (B.1.1.7) or δ (B.1.617.2) variants, all at an MOI = 10, and incubated for 24 h before immunostaining for viral and PC markers. (A) Immunofluorescence images show SARS-CoV-2 nucleocapsid protein (N, magenta) and double-stranded RNA (dsRNA, orange) indicative of virus replication. Nuclei are stained with DAPI (blue). PDGFRβ stains PCs (green). For PCs, we show example images from two patients. Because of the high magnification used (20×), the images shown for patient #2 are not representative of the real % of infection, but we aimed to provide examples of infected PCs in each experimental group. (B) Quantification of the percentage of PCs positive for dsRNA in the three experimental groups. The bar graph reports individual values and means ± SEM. (C) Analysis of ACE2 and CD147 protein levels in cardiac PCs using Western blotting. (D) Table showing the row data of the PC infection and summarising the patients’ characteristics and cell source. Abbreviations: LV, left ventricle; RA, right atrium; RV, right ventricle.

