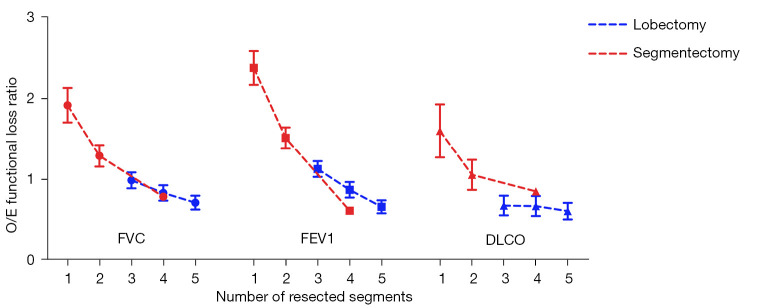
Figure 2.
The ratio of the observed to the expected (O/E ratio) postoperative pulmonary function loss based on the number of resected segments. The dots represent the mean values of the ratios, while the upper and lower whiskers represent 95% confidence intervals. The dashed lines connecting each dot depict the tendency of change in the O/E ratio. DLCO, diffusing capacity of the lungs for carbon monoxide; FEV1, forced expiratory volume in 1 second; FVC, forced vital capacity.

