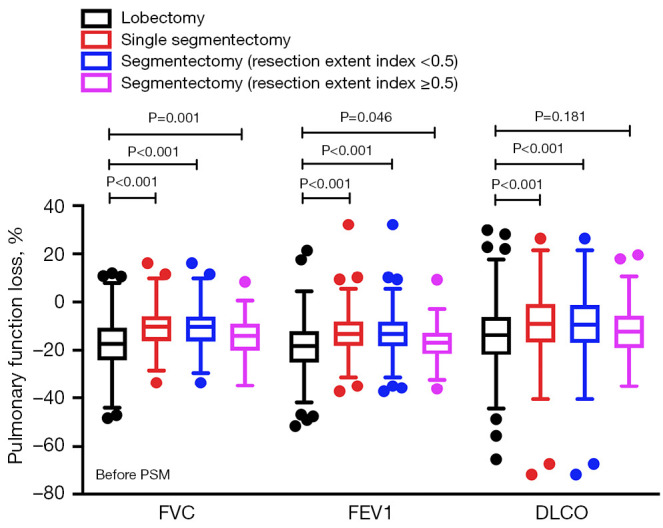
Figure 3.

Comparison of pulmonary function changes between VATS lobectomy and VATS segmentectomy according to the resection extent index before propensity score matching. The upper and lower borders of the box represent the upper and lower quartiles, and the middle horizontal line represents the median, while the upper and lower whiskers represent the maximum and minimum values of non-outliers. The outliers are represented by the extra dots. DLCO, diffusing capacity of the lungs for carbon monoxide; FEV1, forced expiratory volume in 1 second; FVC, forced vital capacity; PSM, propensity score matching; VATS, video-assisted thoracic surgery.
