
Figure 9.
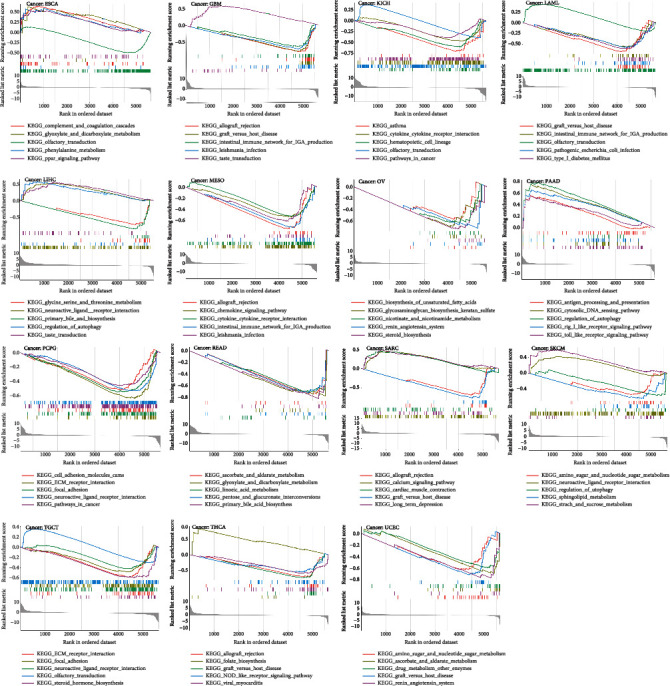
KEGG analysis of high and low expression of BACE1-AS in pan-cancer. Each of the different colored lines represents a specific gene set. The upregulated genes were showed at the left side near the origin, while the downregulated gene set was at the right side. Only P value < 0.05 was considered significant.