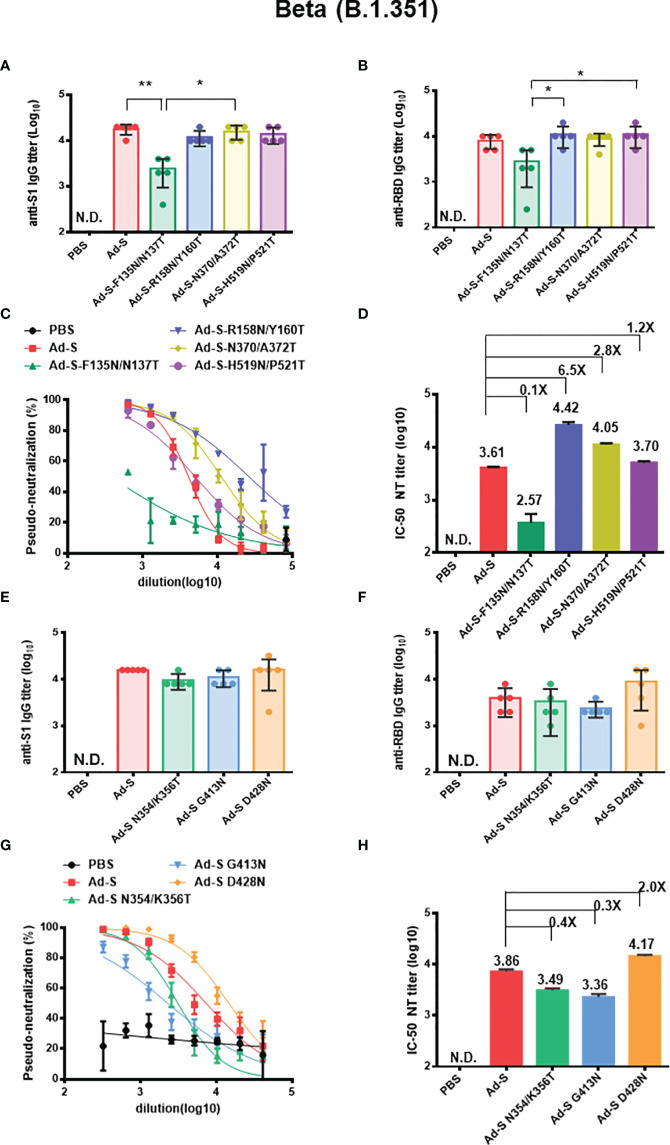
Figure 5.
Antibody responses elicited by Ad-S glycan-masking mutants against SARS-CoV-2 Beta (B.1.351) variant. (A) antisera for anti-S1 IgG titers from each group of mice (n=5) and tested individually in the first set of immunizations; (B) antisera for anti-RBD IgG titers from each group of mice (n=5) and tested individually in the first set of immunization experiments; (C) the dose-response pseudo-neutralization curves for the pooled sera of each immunized group of mice (n=5) and measured in triplicate for the first set of immunization experiments; (D) IC-50 NT titer for neutralizing antibodies against Beta (B.1.351 variant) for the first set of immunization experiments; (E) antisera for anti-S1 IgG titers from each group of mice (n=5) and tested individually in the second set of immunizations; (F) antisera for anti-RBD IgG titers from each group of mice (n=5) and tested individually in the second set of immunization experiments; (G) the dose-response pseudo-neutralization curves for the pooled sera of each immunized group of mice (n=5) and measured in triplicate for the second set of immunization experiments; (H) IC-50 NT titer for neutralizing antibodies against Beta (B.1.351 variant) for the first set of immunization experiments. Fold-changes of the Ad-S glycan-masking mutant IC-50 NT titer against the wild-type Ad-S (Beta, B.1.351 variant) titer are indicated. Statistical tests for multiple comparison of anti-S1 and anti-RBD IgG titers among Ad-s immunization groups were performed using the nonparametric test with Kruskal-Wallis with corrected Dunn’s multiple comparison. The statistical significance is expressed as follows: *p < 0.05 and **p < 0.01. Neutralization curves were fitted based on the equation of nonlinear regression log (inhibitor) vs. normalized response – variable slope using GraphPad Prism v6.01. The IC-50 values of neutralization were obtained from the fitting curves using GraphPad Prism v6.01. Error bars are plotted as standard deviation from the mean value. Not detectable for N.D.

