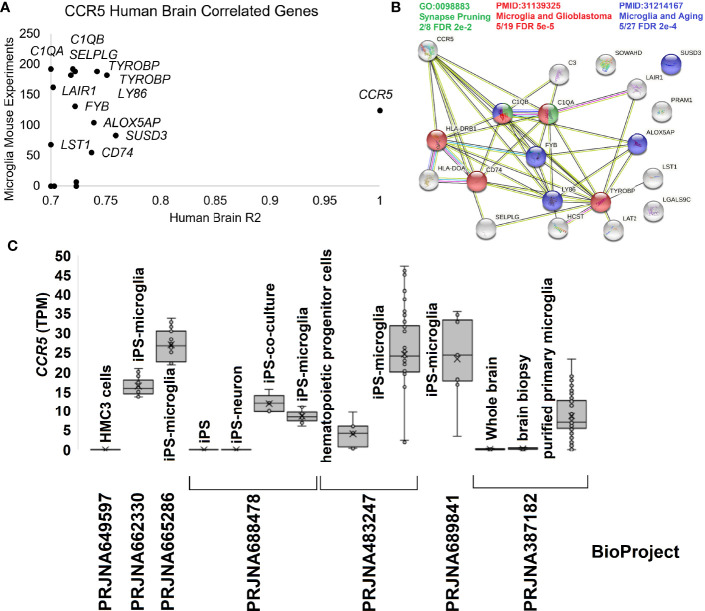
Figure 5.
Human brain CCR5 and microglia. (A) The correlation of genes to CCR5 from the Allen Brain Atlas Human Brain microarray data for 500 samples relative to their expression in mouse microglia single-cell experiments. The x-axis shows the genes R2 from microarray relative to CCR5 expression, while the y-axis shows the number of experiments the gene is detected in mouse single-cell datasets for microglia. (B) STRING protein network for genes in panel (A) showing the enrichment of synapse pruning (green), microglia/glioblastoma (red), and microglia/aging (blue) genes. (C) Expression of CCR5 in transcripts per million (TPM) from seven BioProjects of human microglia cells or related experiments.

