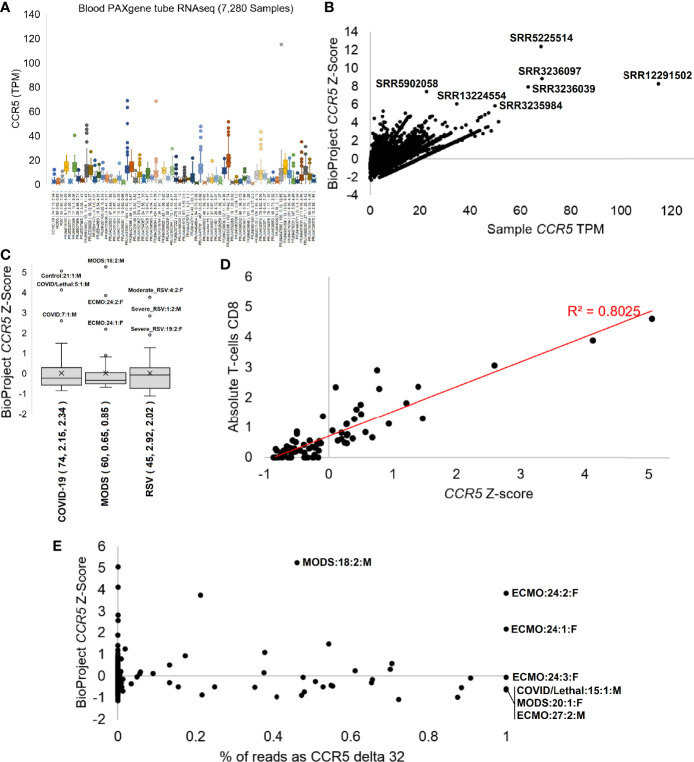
Figure 7.
CCR5 expression in blood PAXgene tube RNAseq. (A) Box and whisker plots for the expression (TPM) of CCR5 from various NCBI BioProjects that were generated by Illumina paired-end RNA-Seq from human blood collected PAXgene tube samples. Listed next to each BioProject code is the number of samples, average CCR5 expression, and standard deviation of CCR5 expression. (B) The TPM expression for each sample (x-axis) of panel (A) relative to the BioProject normalized Z-score (y-axis). The top seven samples based on Z-score are labeled. (C) The Z-scores for our three pilot precision transcriptome datasets, with outlier samples labeled. (D) The COVID-19 study analysis of CCR5 normalized expression relative to CIBERSORTx absolute CD8 T-cell values. (E) The percent of transcripts containing the delta 32 variant relative to wild type (x-axis) for samples of panel (C) relative to the BioProject normalized Z-Score. All homozygous samples for delta 32 are labeled as is the heterozygous sample with the highest study Z-score.

