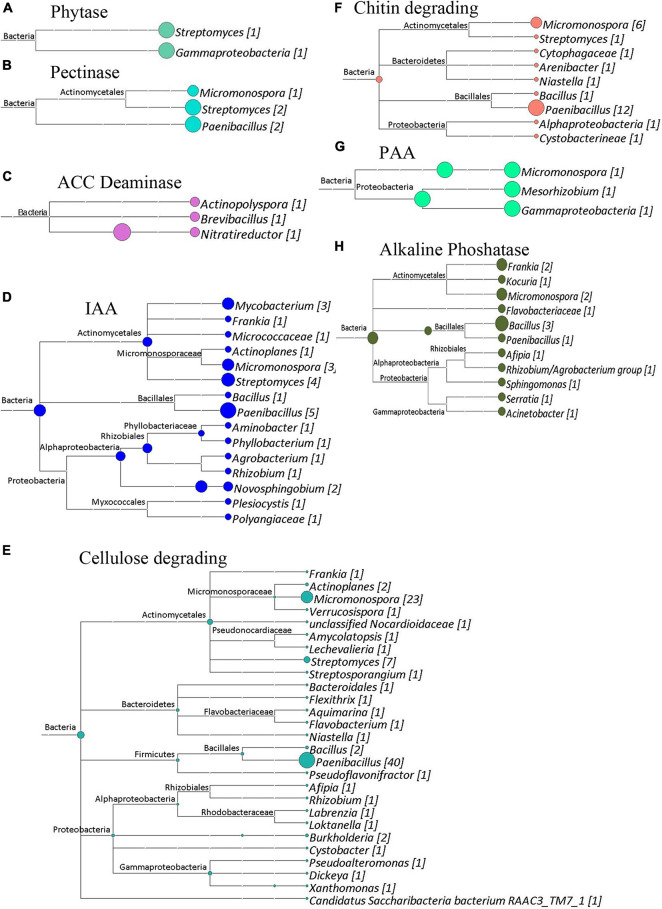
FIGURE 8.
Cladograms of functional genes from Site 2 (Sidi Bouzid), that were produced by the LCA Algorithm in MEGAN (Version 5). The sizes of colored circles represent that relative contribution of a taxa to the functional genes analyzed in a given cladogram. Numbers in Brackets represent that number of genes that annotated to a given taxon for that set of genes. (A) Phytase genes. Total genes identified, 8. (B) Pectinase enzymes. Total genes identified, 5. (C) ACC deaminase genes. Total genes identified, 3. (D) Potential indole acetic acid biosynthesis genes. Total genes identified, 27. (E) Cellulose degrading enzymes. Total genes identified, 97. (F) Chitin degrading enzymes. Total genes identified, 25. (G) Potential phenyl acetic acid biosynthesis genes. Total genes identified, 3. (H) Alkaline phosphatase genes. Total genes identified, 15.

