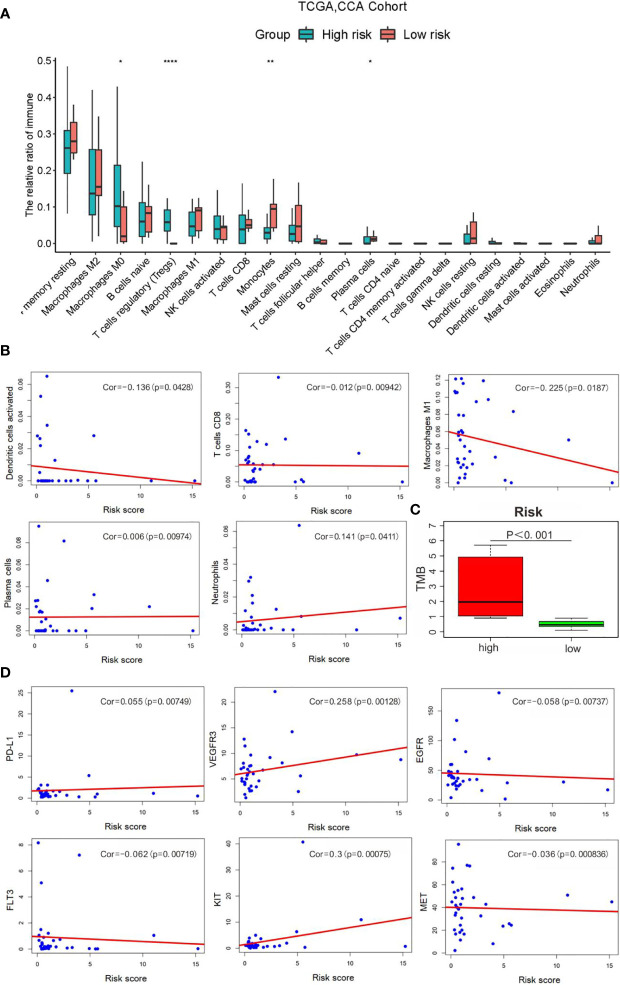
Figure 9.
Correlation analysis of risk scores with the clinical characteristics, immune cells and therapy targets. (A) Relative infiltration expression of 22 immune cells between different risk groups. (*P < 0.05, **P < 0.01, ****P < 0.0001); (B) Correlation of with immune cells; (C) TMB evaluation; (D) Correlation with therapy targets.

