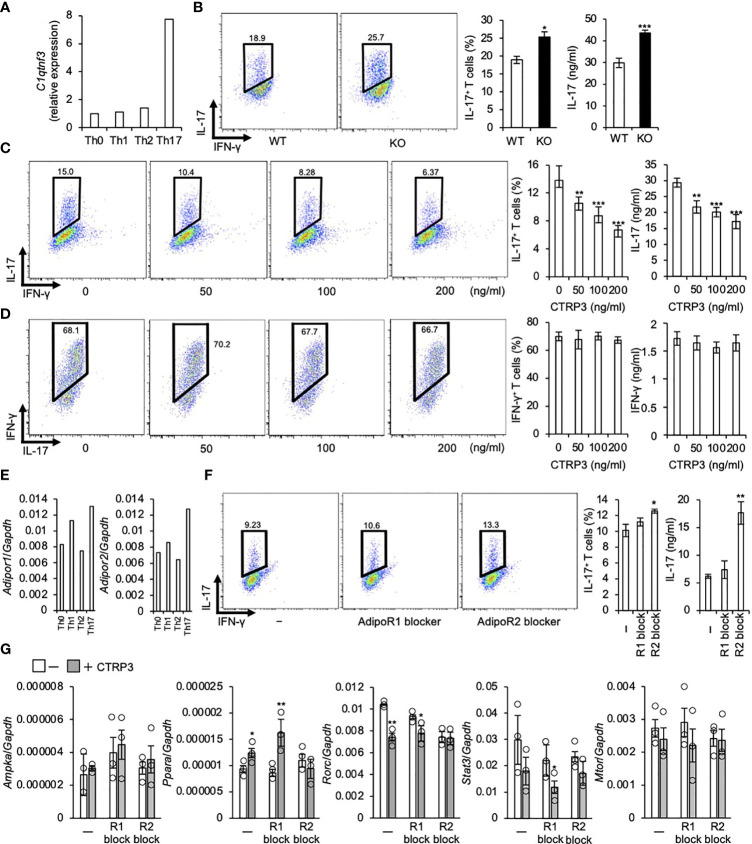
Figure 1.
CTRP3 inhibits the differentiation of Th17 cells in an autocrine manner. (A) The relative expression of C1qtnf3 mRNA in different Th subsets was determined by real-time PCR, and the expression levels are shown relative to that of Th0 cells. Th0, Th1, Th2 and Th17 cells were prepared as described in the Materials and Methods section. (B) WT or C1qtnf3 –/– (KO) naïve CD4+ T cells were cultured under Th17-polarizing conditions for 4 days (n = 4 each). Intracellular IL-17 expression was estimated by flow cytometry after PMA/ionomycin stimulation. The numbers in each panel indicates percentage of IL-17+CD4+ T cells in total CD4+ T cells (2 left panels). The content of IL-17+CD4+ T cells in total CD4+ T cells (%) (center), and IL-17 concentrations (ng/ml) in culture supernatant determined by ELISA (right). Average and SEM are shown. *p < 0.05, ***p < 0.001. Student’s t-test. (C) C1qtnf3 –/– naïve CD4+ T cells were cultured under Th17-polarizing conditions in the absence or presence of recombinant CTRP3 (50, 100 and 200 ng/ml) for 4 days (n = 4 wells each). Intracellular IL-17 expression was estimated by flow cytometry after PMA/ionomycin stimulation. The number in each panel indicates the percentage of IL-17+CD4+ T cells (left), and the proportion of IL-17+CD4+ T cells is shown in the center panel. IL-17 concentration in the culture supernatant was determined by ELISA (right). Average and SEM are shown. **p < 0.01, ***p < 0.001. Student’s t-test. (D) C1qtnf3 –/–naïve CD4+ T cells were cultured under Th1-polarizing conditions for 3 days (n = 4 wells each). Intracellular IFN-γ expression was evaluated by flow cytometry after PMA/ionomycin stimulation. The number in each panel indicates the percentage of IFN-γ +CD4+ T cells in total CD4 T cells (left). The population of IFN-γ +CD4+ T cells (center). IFN-γ concentration in the culture supernatant determined by ELISA (right). Average and SEM are shown. Student’s t-test. (E) The expression of Adipor1 and Adipor2 mRNA in different Th subsets was determined by real-time PCR and relative expression levels to that in Th0 cells are shown. (F) C1qtnf3 –/– naïve CD4+ T cells were cultured with recombinant CTRP3 (200 ng/ml) under Th17-polarizing conditions in the absence (-) or presence of AdipoR1 blocker (R1 block, 10 μg/ml) or AdipoR2 blocker (R2 block, 10 μg/ml) for 4 days (n = 4 each). Intracellular IL-17 expression was evaluated by flow cytometry after PMA/ionomycin stimulation. The number in each panel indicates percentage of IL-17+CD4+ T cells (left). The IL-17+CD4+ T cell content (center). IL-17 concentration in the culture supernatant determined by ELISA (right). Average and SEM are shown. *p < 0.05, **p < 0.01. Student’s t-test. (G) The effect of AdipoR1 blocker and AdipoR2 blocker on the regulatory effects of CTRP3 on Th17 cell gene expression was examined. In vitro differentiated C1qtnf3 –/– Th17 cells (1 x 10⁵ cells in 200 μl/96 well) were treated with CTRP3 (200 ng/ml) in the presence or absence of AdipoR1 blocker (10 μg/ml, R1 block) or AdipoR2 blocker (10 μg/ml, R2 block), and the expression of Ampka, Ppara, Rorc, Stat3 and Mtor mRNA was determined by real-time PCR. The relative expression levels to that of Gapdh are shown. These data are the average from three independent experiments. Average and SEM are shown. *p < 0.05, **p < 0.01. Student’s t-test. All data were reproduced in another independent experiment with similar results.

