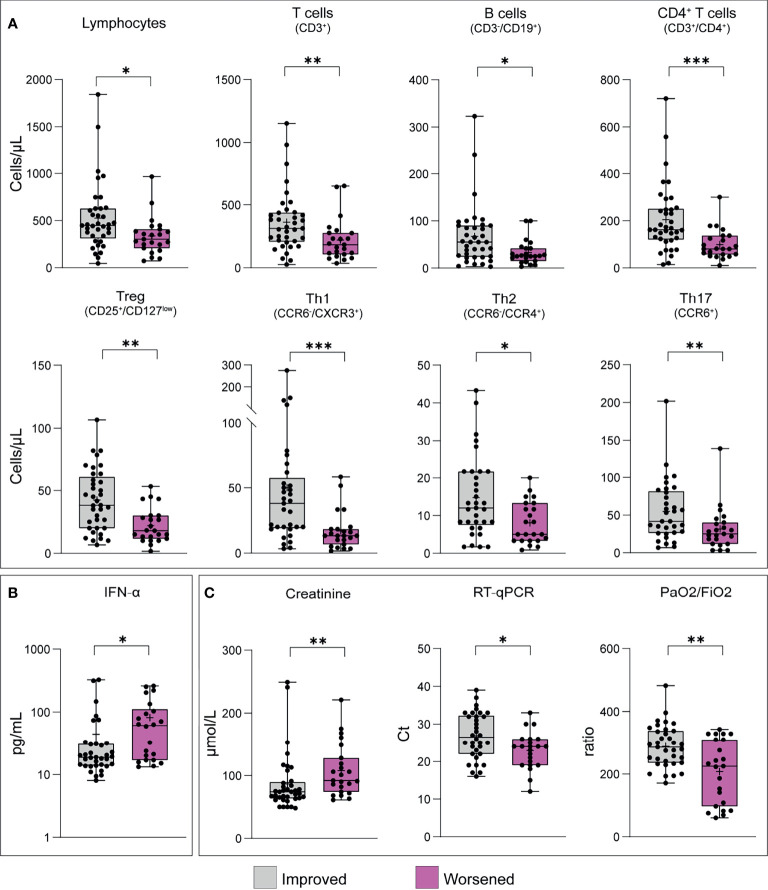
Figure 3.
T cell frequencies, cytokine concentrations and laboratory findings in patients classified according to the clinical course during hospitalisation. Patients were classified as improved (n = 37) or worsened (n = 23) as reported in the methods section. (A) T cell and T cell subset frequencies; (B) cytokine concentration; (C) laboratory findings. Only results statistically significant are reported. Statistical significance, set at p-value <0.05, was assessed using the Mann-Whitney U test. *p < 0.05; **p < 0.01; ***p < 0.001. Whiskers represent minimum and maximum values, dots represent individual observations, the + on each box indicates the mean.

