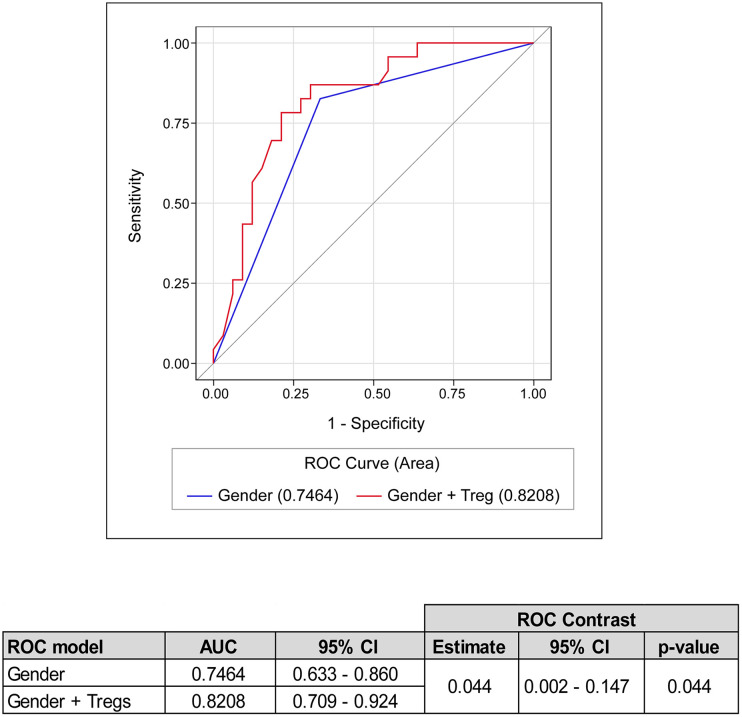
Figure 4.
ROC curve selection analysis. ROC analysis for the discrimination of improved and worsened clinical course during hospitalisation. The best individual discriminator (i.e., gender) and the best combination (i.e., gender + Tregs) are reported. AUC, Area Under the ROC Curve; 95% CI, 95% CI confidence interval.

