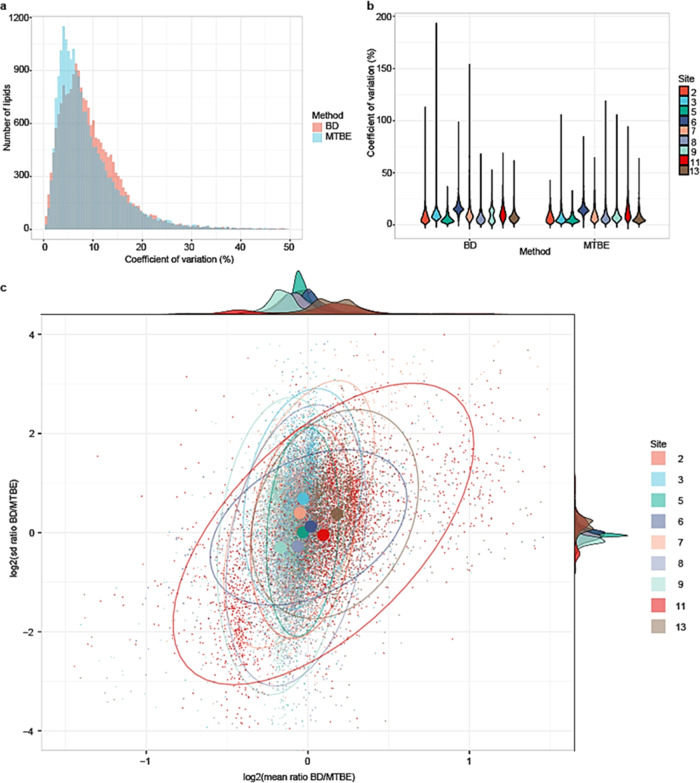
Figure 1.
Comparison between BD and MTBE lipid extraction methods. (a) Histogram of overlapping lipids between the two methods with CV values on the x-axis and counts of lipid species on the y-axis. (b) Violin plot to compare the performance of sites between the two methods. (c) Scatter plot to summarize the performance of each laboratory between the method: the x-axis represents the ratio of mean concentration of the BD extraction method to the MTBE method using the base-2 logarithmic scale and the y-axis represents the ratio of standard deviation of the two methods. Larger dots represent the center of the distribution of the data points for each laboratory calculated from the fitted distribution (represented by the ovals). The ovals represent 95% of the data entries using the fitted multivariate t-distribution.

