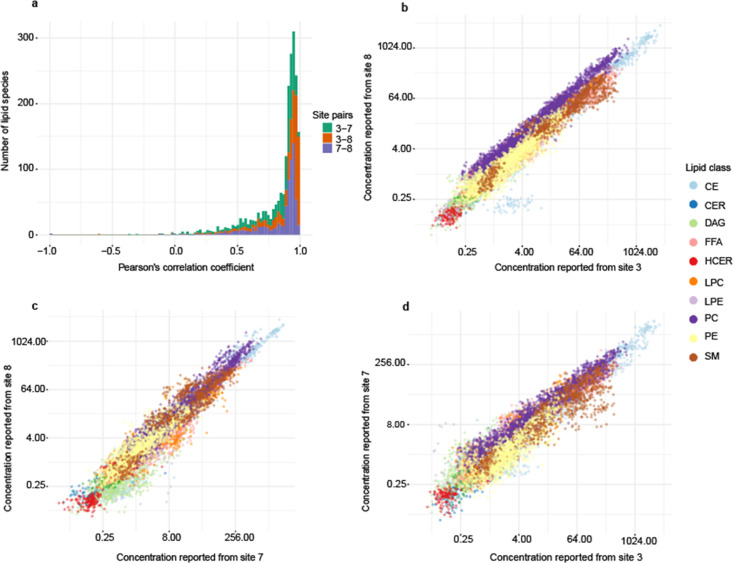
Figure 5.
Correlation of reported concentration of lipids in 59 plasma samples related to familial hypercholesterolemia between three sites. (a) Histogram of pairwise Pearson’s correlation coefficient between three sites. (b–d) Correlation of the reported lipid concentrations between sites 3 and 8, 7 and 8, and 3 and 7, respectively.

