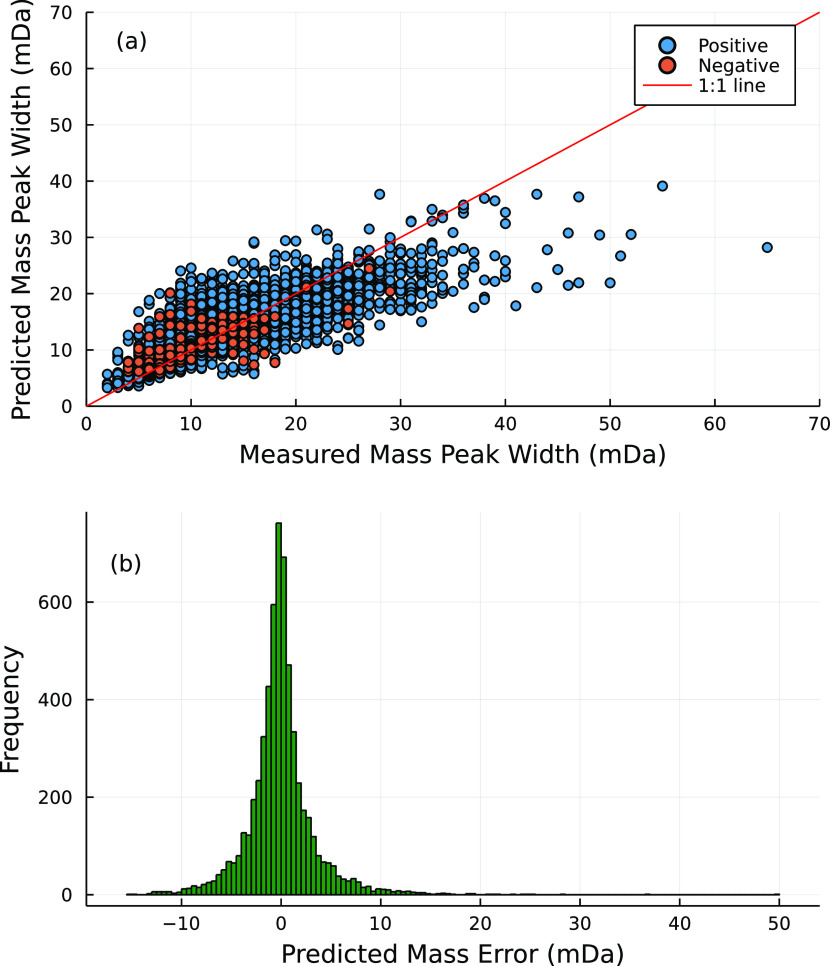
Figure 3.
(a) Distribution of 10,000 randomly selected measured mass peak widths (mDa) from the test set vs the predicted mass peak widths and (b) the distribution of the prediction errors in mDa. The red points were measured in the negative mode(i.e. ESI−) while the blue points were measured in the positive mode(i.e. ESI+).

