
FIGURE 3.
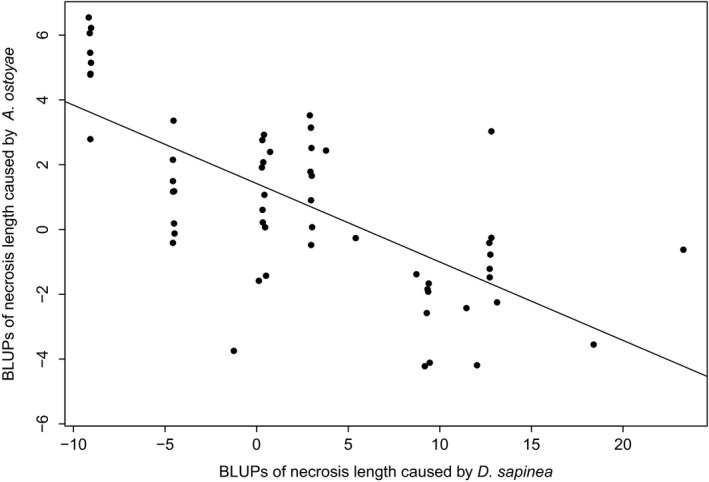
Correlation of trait variation across Pinus pinaster populations based on BLUPs (best linear unbiased predictors) for necrosis length caused by Diplodia sapinea and Armillaria ostoyae. A linear trend line is also shown (Pearson's correlation coefficient = −0.692, p‐value< 0.001)