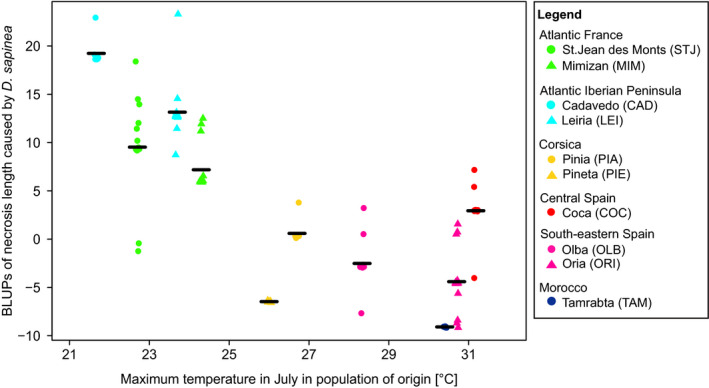
FIGURE 4.

Stripchart of combined genotype and population BLUPs (best linear unbiased predictors) for necrosis length caused by D. sapinea plotted against the maximum temperature in July in the population of origin. Populations were assigned to one of the six gene pools identified by Jaramillo‐Correa et al. (2015), corresponding to the six colors in the figure. Symbols indicate different populations of the same gene pool. Black lines indicate the average necrosis length in each population
