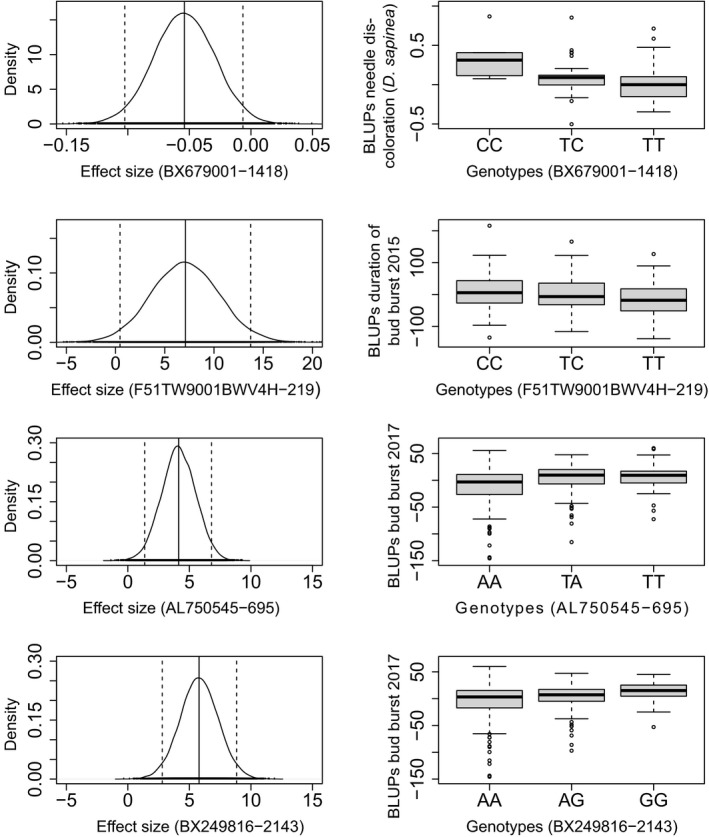
FIGURE 5.

Density plots (left) of the effect sizes based on 20,000 BAMD simulations with 95% confidence intervals (dashed lines) and genotypic effects (box plots, right) for four non‐synonymous single nucleotide polymorphisms (SNPs) showing significant association with (from top to bottom) needle discoloration caused by Diplodia sapinea, duration of bud burst in 2015, and bud burst in 2017 (two SNPs) in Pinus pinaster
