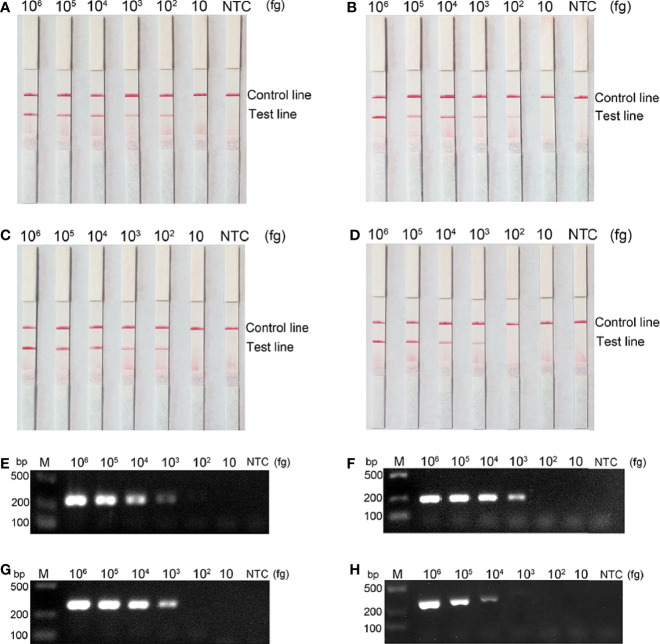
Figure 5.
Comparison of the sensitivity between the RPA-LFS reaction and PCR for detection of the four carbapenemase gene families. The amount of template added to each reaction is marked above the corresponding strip. (A–D) detection sensitivity of the RPA-LFS assay and (E–H) detection sensitivity of the PCR assay, representing bla KPC, bla NDM, bla OXA-48-like and bla IMP, respectively. The NTC strip is the control reaction without a template.

