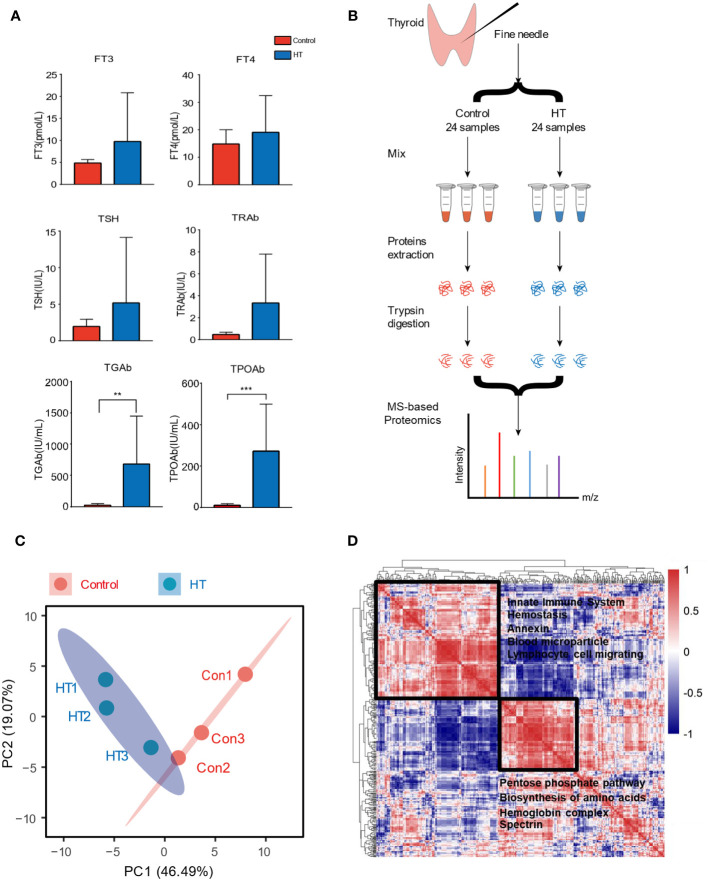
Figure 1.
Overview of sample preparation and result analysis presentation of proteomics. (A) Comparison of antibody concentration in serum of Hashimoto’s thyroiditis (HT) and healthy controls. (B) Here, 24 patients and 24 healthy people were divided into two groups, the samples were acquired by fine-needle aspiration, and eight samples were mixed into one tube for subsequent mass spectrometry (MS). (C) Principal component analysis (PCA) biplot of protein concentration level; red dots represent the cluster Control, while blue dots represent the cluster HT. The first two axes accounted for 65% of variance. (D) Global correlation map of proteins generated by clustering the Pearson correlation coefficients of all possible protein combinations. The abundance of proteins with common regulation correlates across samples, and they therefore form a cluster. Prominent clusters are annotated with functional terms obtained from bioinformatics enrichment analysis. The inset shows the color code for Pearson correlation coefficients. Error bars show the mean ± SEM. Asterisks signify significant differences using one-way ANOVA, **P < 0.01; ***P < 0.001.

