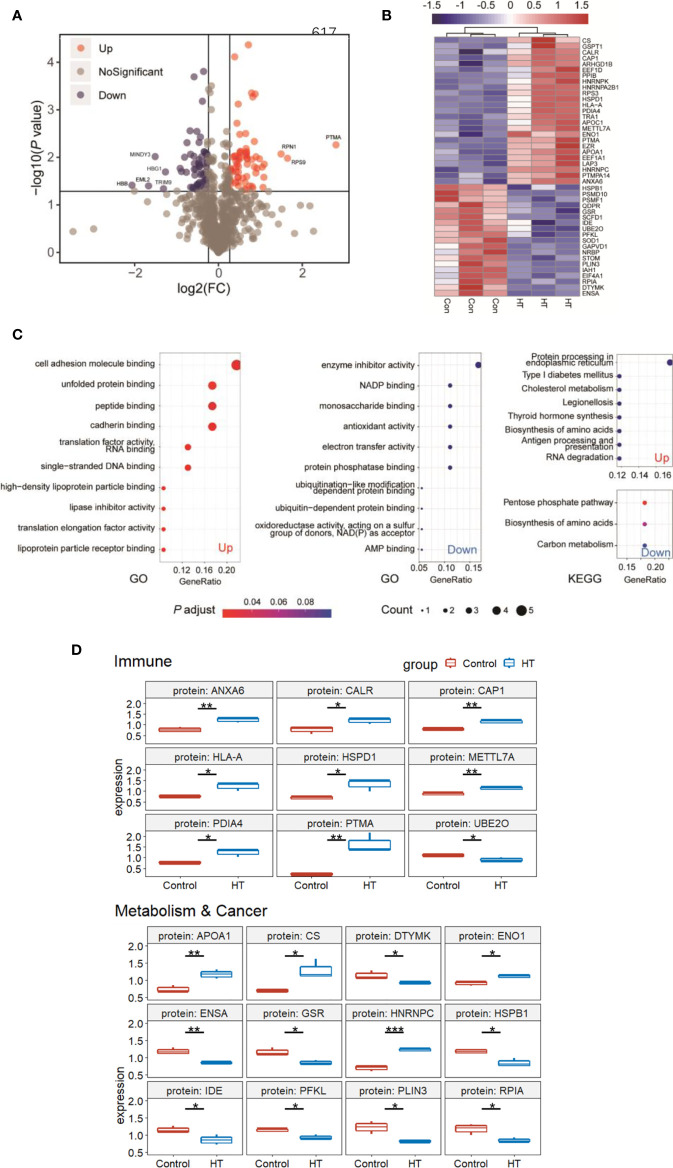
Figure 2.
Significant differences in protein expression between Hashimoto’s thyroiditis (HT) patients and healthy people. (A) Volcano plot of proteomic data. Volcano plots are depicted with the fold change of each protein, and the P-value was calculated by performing t-test. Red circles show proteins that have significant increases. Blue circles show proteins that have significant decreases. Gray circles are proteins without any differences. (B) Heat map of the 44 differentially expressed protein (DEPs) information. (C) GO and KEGG pathway analysis of 26 upregulated and 18 downregulated genes. (D) Summary of DEPs in key functional groups that show differences between HT and Control. DEPs related to the immune system and metabolism&cancer are shown in boxplots. Median value was marked. *P < 0.05; **P < 0.01; ***P < 0.001.

