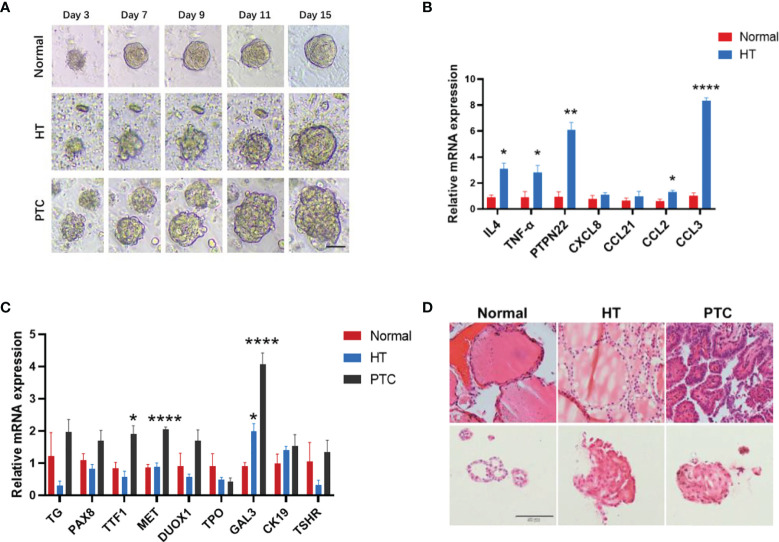
Figure 4.
Organoid cultures derived from patients with Hashimoto’s thyroiditis (HT) and papillary thyroid carcinoma (PTC). (A) Time-lapse imaging sequence of Control, HT, and PTC organoids. Scale bar, 100 μm. (B) Quantitative PCR (qPCR) analysis of the HT and chemokine characterization marker mRNA level in thyroid organoids (Normal, n = 4; HT, n = 4). (C) qPCR analysis of the HT characterization marker mRNA level in thyroid organoids (Normal, n = 3; HT, n = 5; PTC, n = 6). All data are presented as mean ± SEM. (D) H&E staining of the organoids and their corresponding tissues, respectively. Scale bar, 50 μm. Error bars show the mean ± SEM. *P < 0.05; **P < 0.01; ****P < 0.00001.

