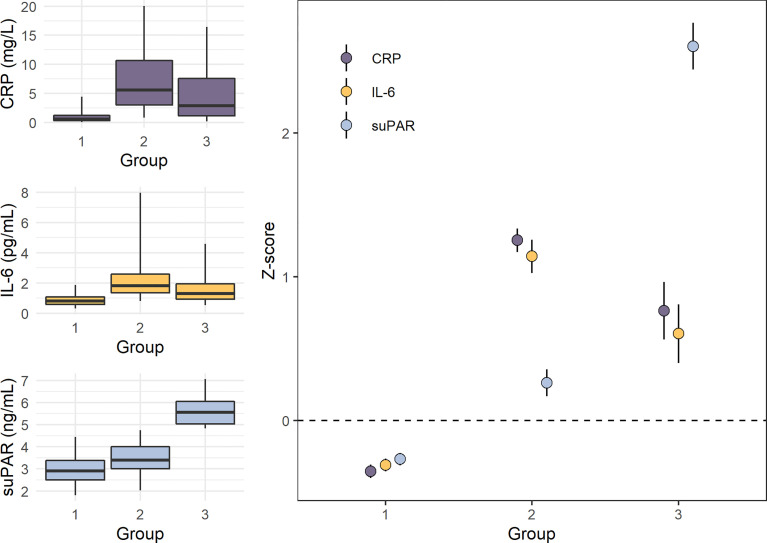
Figure 5.
Levels of CRP, IL-6, and suPAR in the three inflammation groups identified by latent class analysis in the E-Risk study (n=1,390). Panels on the left show boxplots (box indicates median and interquartile range, and whiskers indicate 95% confidence interval) of untransformed C-reactive protein (CRP), interleukin-6 (IL-6), and soluble urokinase plasminogen activator receptor (suPAR) levels in the three groups, while the panel on the right shows mean Z-scores with standard deviations (M=0, SD=1). Group 1 (n=1,057) consisted of individuals with low CRP, IL-6, and suPAR. Group 2 (n=249) consisted of individuals with high CRP and IL-6 and moderately elevated suPAR. Group 3 (n=84) consisted of individuals with elevated CRP and IL-6 and high suPAR. Data from Rasmussen LJH, et al. (2020) (163).

