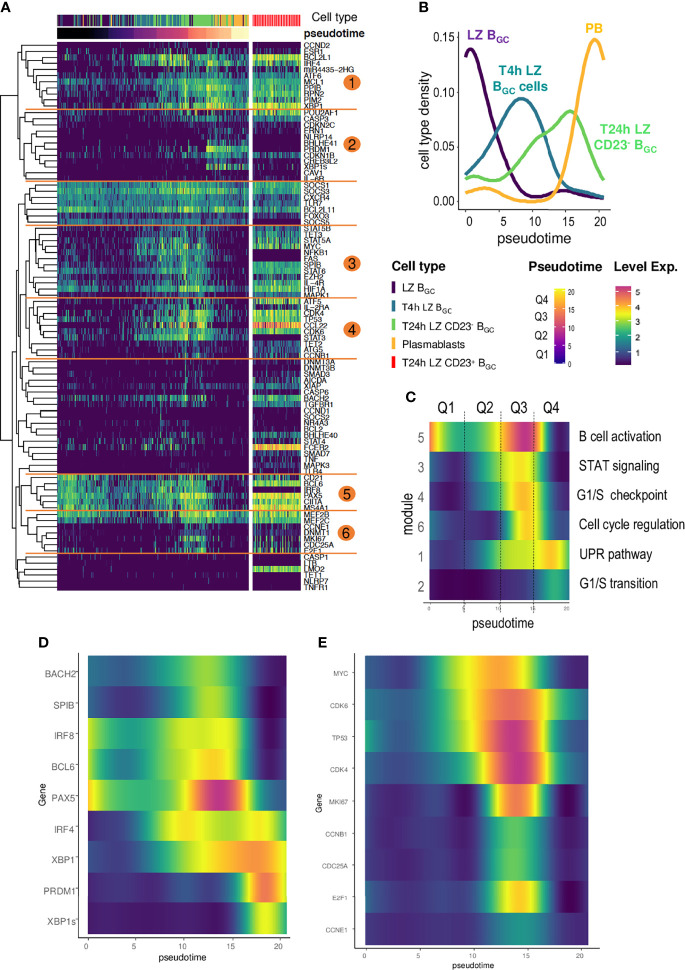
Figure 6.
The time course of gene analysis during LZ BGC-cell differentiation. (A) A heatmap computed for Monocle-ordered cells (LZ BGC-cells, PBs, T4h LZ BGC-cells, T24h CD23+ LZ BGC-cells, and CD23- LZ BGC-cells), showing six different gene modules annotated with GeneMANIA. The pseudotime scale was calculated from the gene expression data. (B) Density of cell subsets in each quadrant of the pseudotime. (C) Smooth analysis of the time course of each module by pseudotime quadrant (Q1 to Q4) for all cell subsets except T24h CD23+ LZ BGC-cells. (D) The time course of gene expression during B cell activation and differentiation into PCs showing (i) a bimodal expression of IRF4, (ii) a striking peak for PAX5, (iii) PRDM1 elevation synchronized with PAX5 decline, and (iv) the specific expression of XBP1s in the last quadrant of the pseudotime compared to XBP1. (E) Gene expression during the differentiation of CD23- LZ BGC-cells for Monocle-ordered cells showing a sequential transition from LZ BGC-cells to PBs for MYC expression, MYC-target genes and gene involved in cell cycle re-entry.

