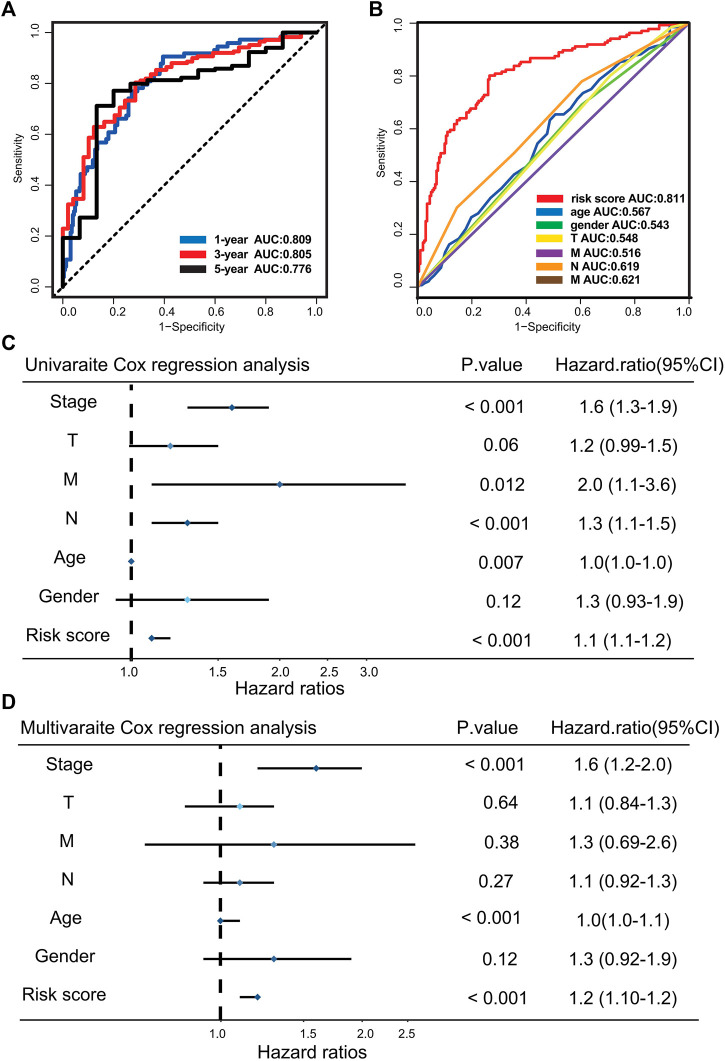
FIGURE 2.
Evaluating the predictive efficacy of the risk model. (A) Time-dependent ROC curve of the risk score at 1, 3, and 5 years. (B) ROC curve for the risk score and clinical characteristics. (C) Univariate Cox analysis for clinical characteristics and the risk score with OS. (D) Multivariate Cox analysis for clinical characteristics and the risk score with OS.

