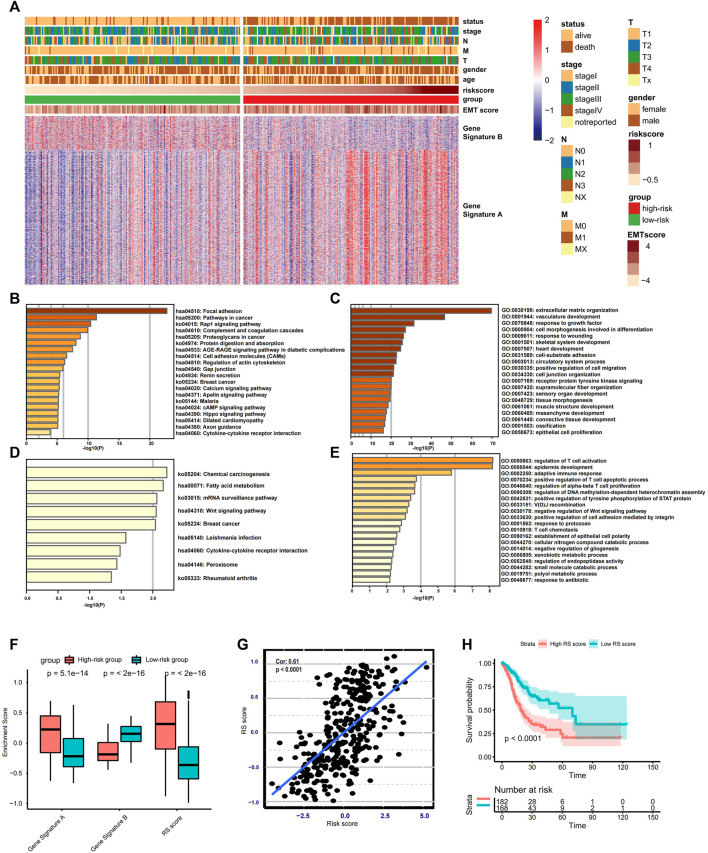
FIGURE 4.
Construction and validation of the RS score. (A) Heat map displaying DEG signatures termed as gene signature A or B between the low- and high-risk groups. (B–E) KEGG and GO enrichment analysis for gene signature A or B. (F) Boxplot showing the difference in the enrichment score of gene signature A or B and the RS score between the low- and high-risk groups. (G) Spearman correlation analysis between RS score and risk score. (H) Kaplan–Meier analysis and log-rank test comparing the OS of patients with different RS scores.

