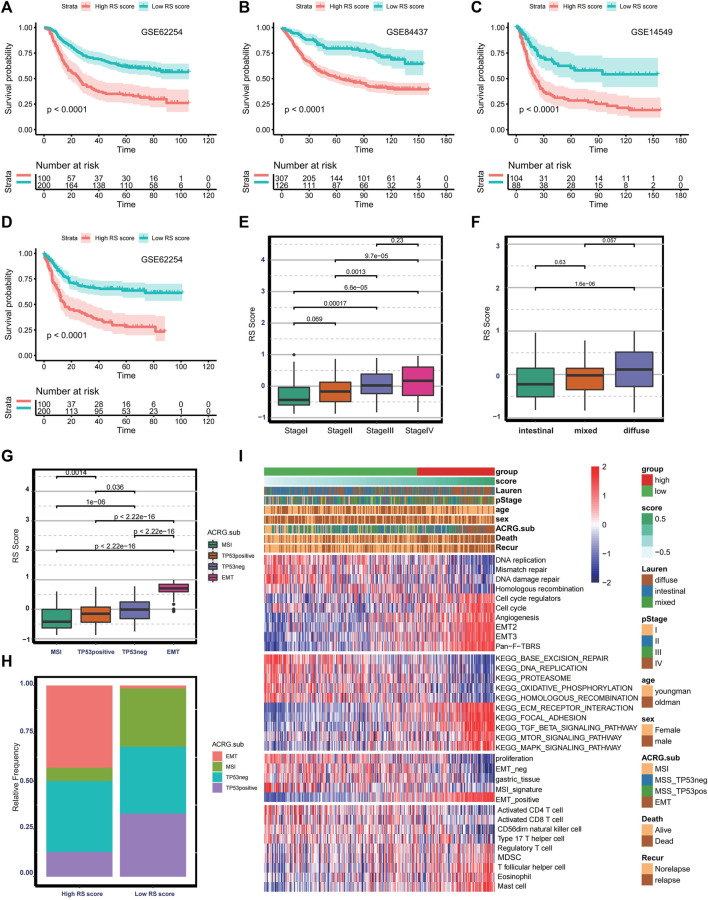
FIGURE 6.
Validation of the prognostic ferroptosis-related lncRNA gene signatures. (A–C) Kaplan–Meier curve and log-rank test comparing OS in patients with low or high RS scores in GSE62254, GSE84437, and GSE14549. (D) Kaplan–Meier curve and log-rank test comparing relapse-free survival in patients with low or high RS score in GSE62254. (E–G) Boxplot comparing RS score in different stages, histological subtypes, and molecular subtypes in the GSE62254. (H) Bar plot presenting the relative frequency of four molecular subtypes between the low- and high- RS-score groups. (I) Heat map showing the difference in the biological characteristics and immune landscape between the low- and high- RS-score group.

