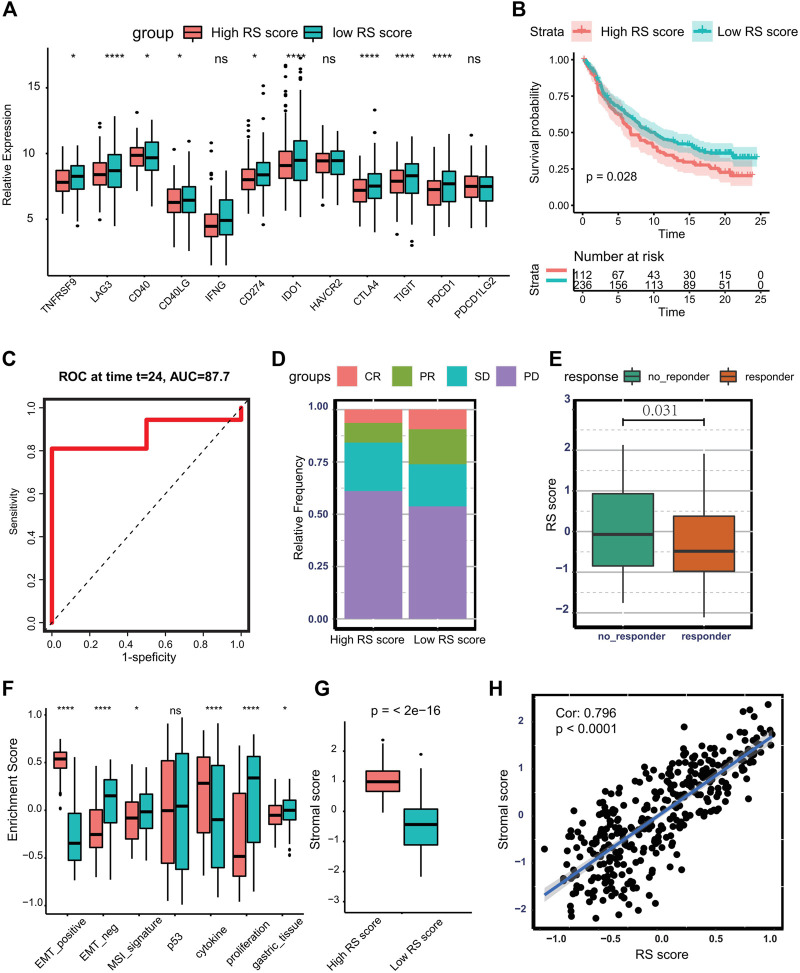
FIGURE 7.
Predicting the therapeutic response of RS score to immunotherapy. (A) Boxplot presenting the expression of multiple checkpoints between the low- and high-RS score groups. (B) Kaplan–Meier curve and log-rank test compare the OS of patients with low or high RS scores in the IMvigor210 cohort. (C) Time-dependent ROC curve for RS score at 2 years in IMvigor210 cohort. (D) Bar plot displaying the relative frequency of different clinical response subgroups in the low or high RS score group. (E) Boxplot demonstrating the RS score difference between response group and no-response group. (F) Boxplot showing different activation degrees of gene signatures characterized by ACRG molecular subtype in the low and high RS score groups. (G) Boxplot presenting stromal score difference in the low and high RS score groups. (H) Spearman correlation analysis between stromal score and RS score in IMvigor210 cohort. (Ns represented no significance; *p < .05; **p < .01; ***p < .001; ****p < .0001).

