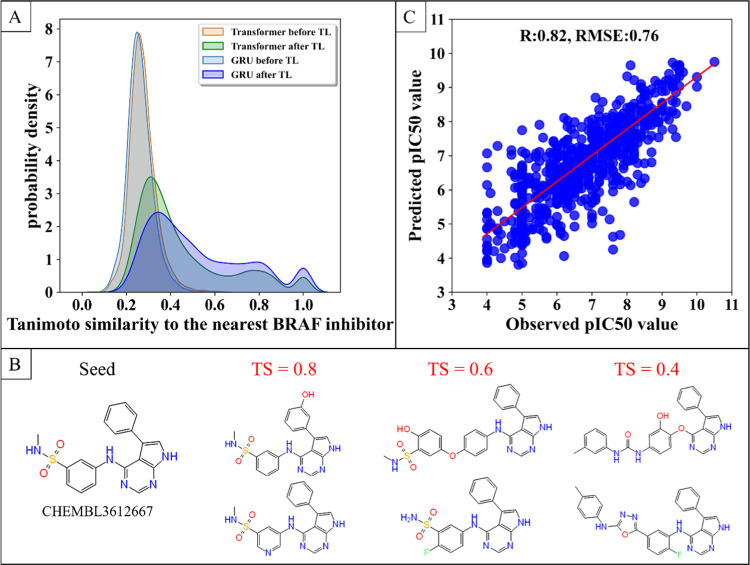
Figure 2.
Performance of the generative model and the predictive model. (A) Distribution of the maximum Tanimoto similarity between the molecules generated by the model and the BRAF inhibitors. (B) Example of the Tanimoto similarity between the generated molecule and the original structure. (C) Comparison between predicted and observed pIC50 values. Metrics reported are Pearson’s correlation coefficient (R) and root-mean-squared error (RMSE).

