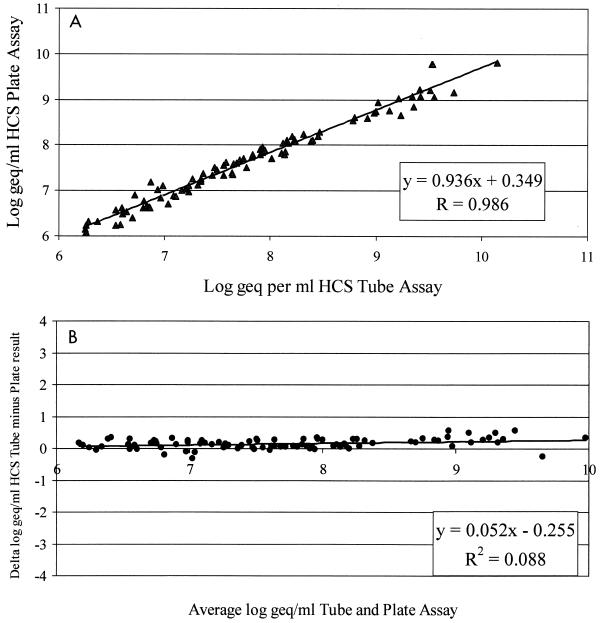
FIG. 1.
(A) Correlation of HCS tube-based assay with HCII HBV. The calculated log10 DNA concentrations were calculated for a set of 89 randomly selected clinical samples. Linear regression analysis showed a Spearman correlation of 0.986. (B) Comparison of HCS tube-based assay and HCII HBV as described by Bland and Altman (2). Only data for samples that were positive and above the detection level of the HCS tube-based assay are included. geq, genome equivalents.

