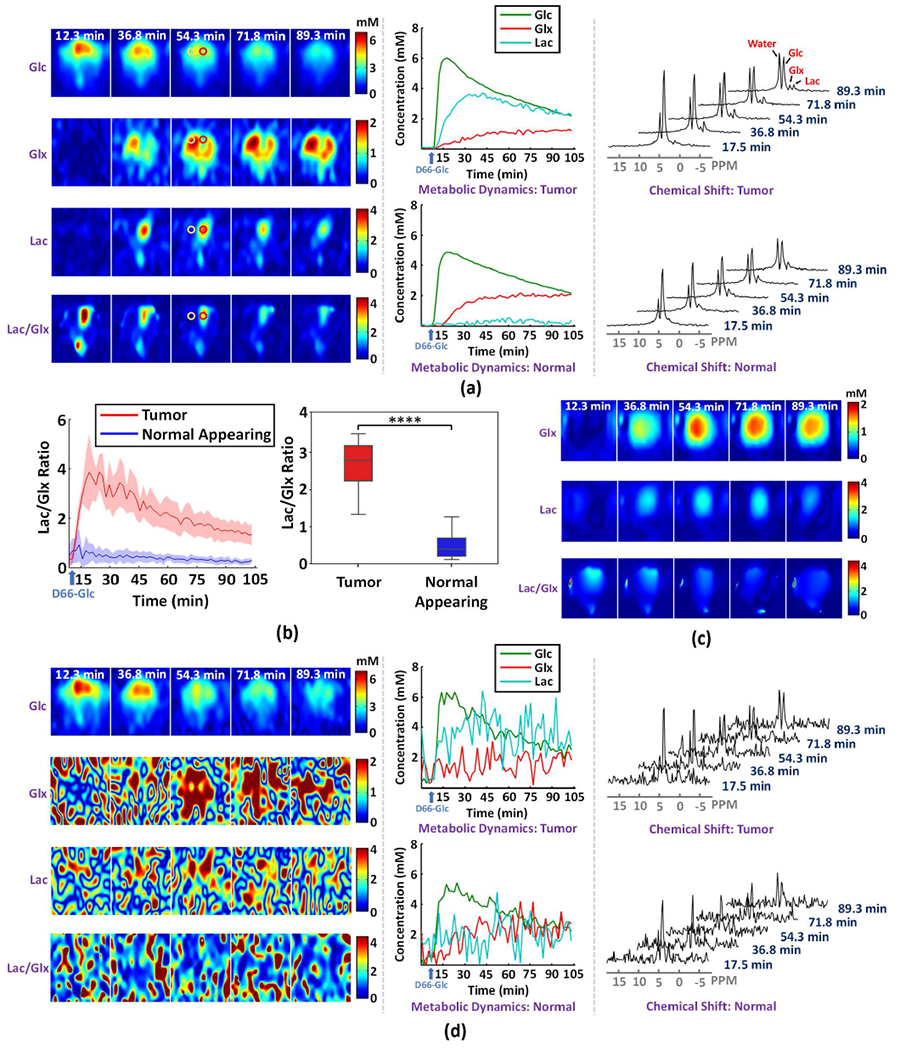
Fig. 4.

High-resolution dynamic DMRSI results of rat brain with a small tumor. (a) Results obtained by the proposed imaging scheme, including time-dependent concentration maps (left panel), metabolic time courses (middle panel), and the time evolution of 2H-spectra (right panel); here, the metabolic time courses and spectra are from voxels at the center of the red and yellow circles within tumor and normal-appearing tissues, respectively. (b) Dynamic change and statistical comparison of [Lac]/[Glx] ratio between tumor and normal-appearing tissues; the left panel illustrates the time-dependent regional comparison, where the solid line and shaded area indicate the mean and standard deviation, respectively; the right panel shows [Lac]/[Glx] ratio averaged over 15 to 105 minutes after the infusion of deuterated glucose (tumor: 2.32 ± 0.58; normal appearing: 0.38 ± 0.19); **** indicates P < 0.0001. (c) Results obtained from retrospectively sampled low-resolution data (spatial resolution: 5.6 × 5.6 × 8.0 mm3). (d) Results obtained by the Fourier-based scheme with the same layout as (a).
