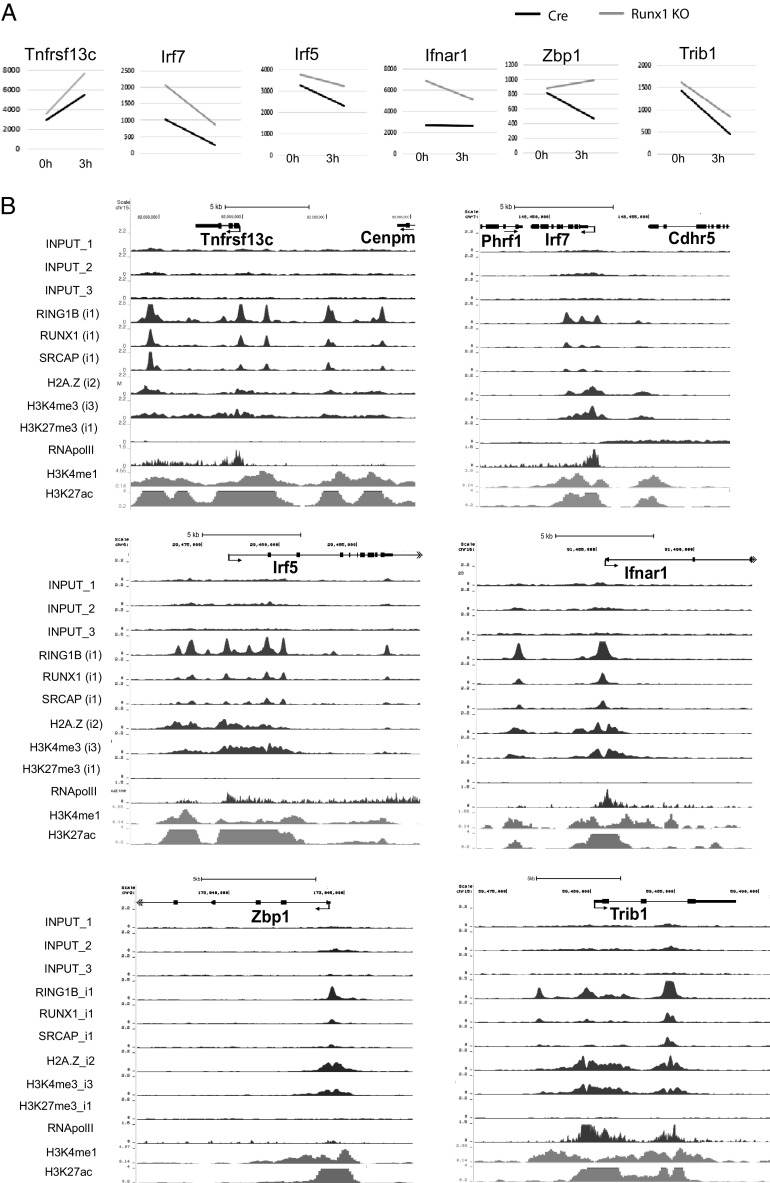
FIGURE 7.
Factor binding profiles of genes that are repressed by RUNX1. (A) Basemean values for expression of genes with functional roles in B cells that are upregulated in the Runx1 c-k/o B cells (see Table I). Values were obtained from the RNA-seq analysis at 0 and 3 h of anti-IgM + IL-4 treatment (see Supplemental Tables I and II). All values are the mean of three biological replicates. Adjusted p values for the differences in gene expression levels were <0.05 for at least one of the points. (B) ChIP-seq tracks showing the profiles of factor binding and histone modification in resting B cells of the genes shown in (A).

