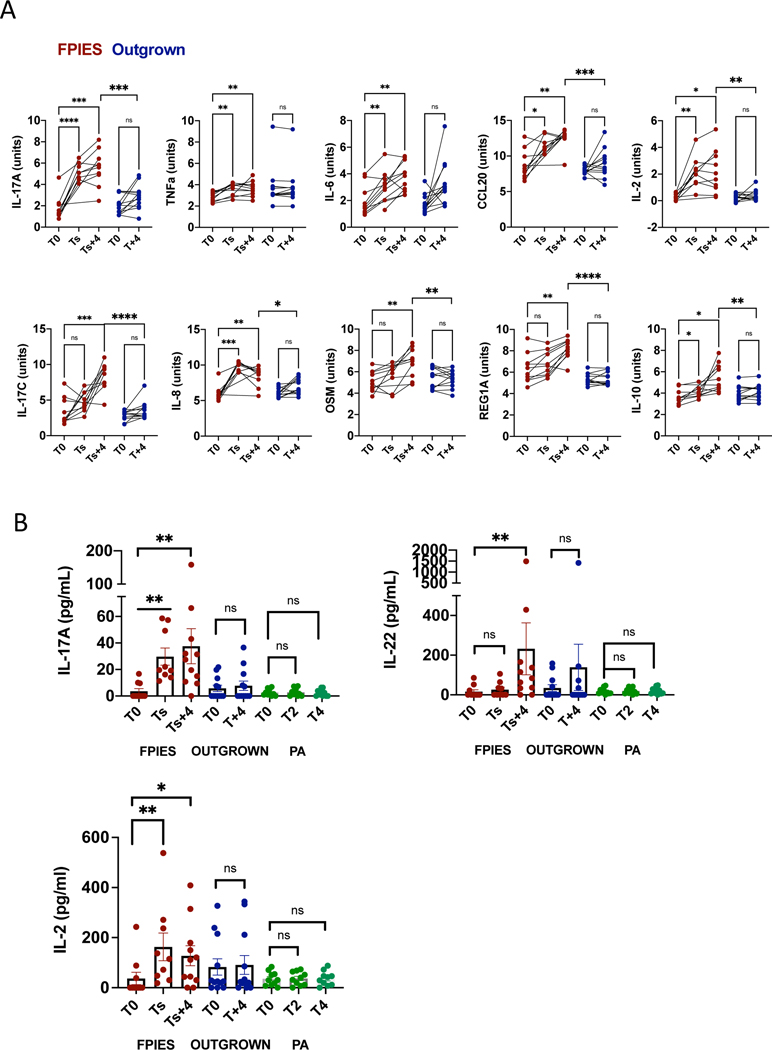
Figure 1: Biomarkers in serum during FPIES challenges.
A.Biomarkers measured by Olink were measured in blood taken at baseline (T0), time of symptom onset (Ts), and 4 h after symptoms (Ts + 4). In those who tolerated the challenge (Outgrown, in blue), blood was obtained at baseline (T0) and 4 h after challenge (T+4). Data are expressed as normalized protein units (Log2 scale). Within group analysis by paired T test, between group analysis by T test. *p<0.05, **<0.01, ***<0.001, ****<0.0001. Each data point is one individual. B. Multiplex immunoassay detection of IL-17, IL-22, and IL-2. For additional disease controls, serum samples from 10 peanut allergic (PA) children who experienced vomiting during peanut challenges were measured. Within group analysis by Mann-Whitney U test.

