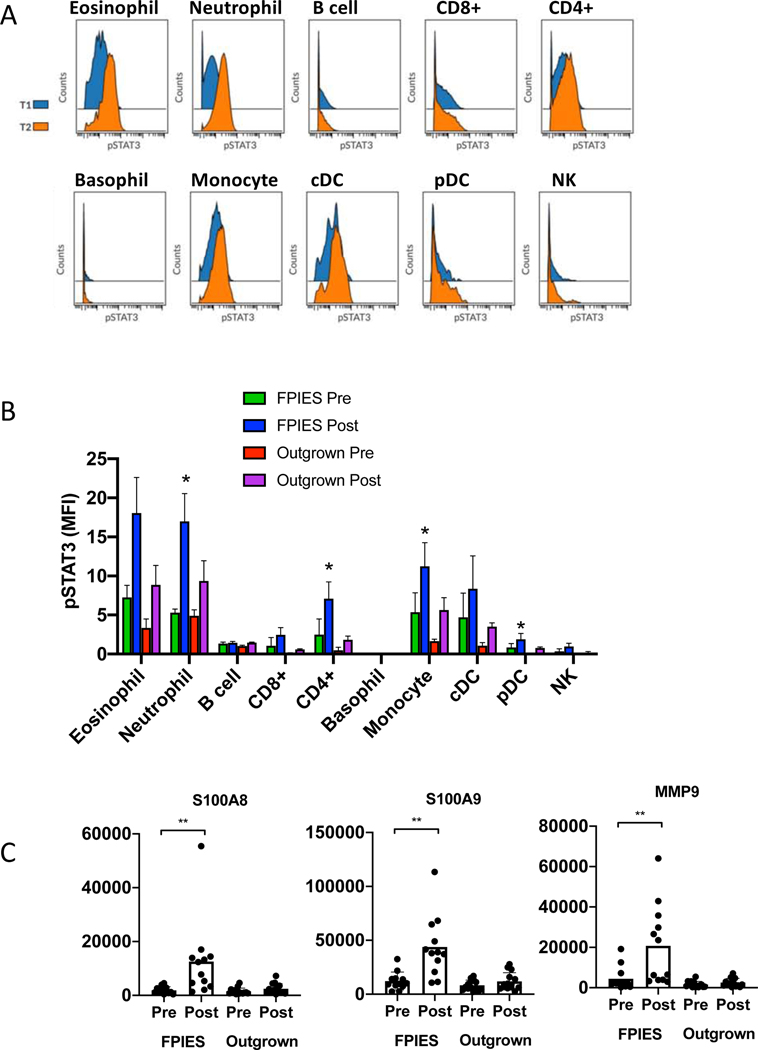
Figure 2: Functional impact of cytokine release.
A: Representative histograms showing p-STAT3 in identified subsets at baseline (blue) and 4 h after symptoms (orange) as measured by mass cytometry. B: summary data of median intensity of STAT3 in cell subsets before and after challenge, in those with active (n=4) or outgrown (n=3) FPIES. C: Expression of IL-17A target genes measured by RNA sequencing of whole blood obtained before or after FPIES challenge. Each dot indicates one patient. *p<0.05 by paired analysis.

