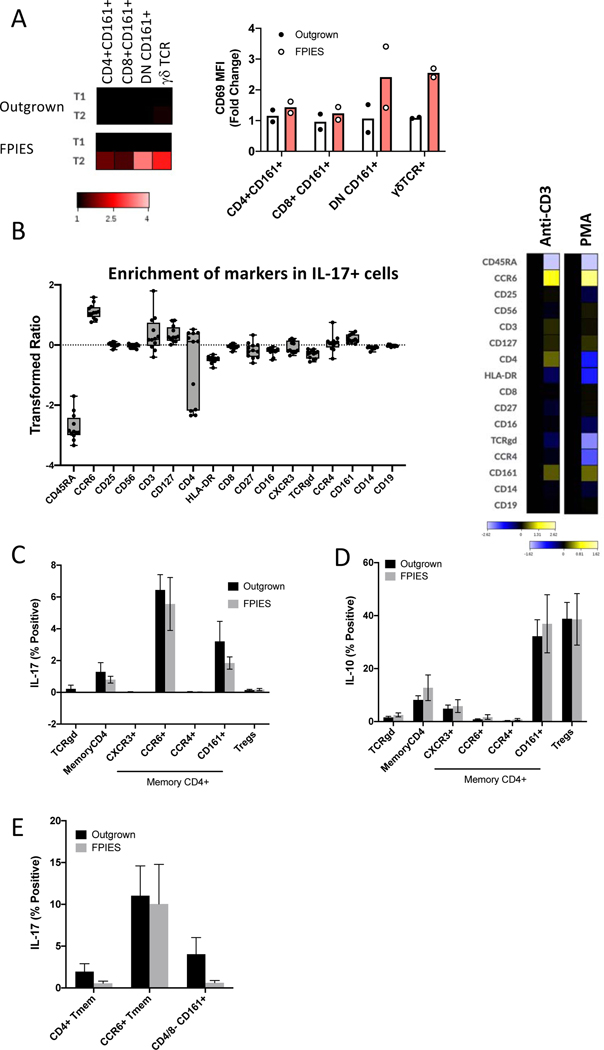
Figure 3: Source of IL-17A in peripheral blood after stimulation.
A. T cell subset activation in peripheral blood as defined by CD69 upregulation. B. To assess potential sources of IL-17, PBMCs from active or outgrown FPIES were stimulated with anti-CD3/CD28 or PMA for 6 h. IL-17+ live singlets were gated, and expression of cell surface markers compared to all live singlets. Left: Quantification of enrichment of each marker across 8 samples. Right: Representative heat map of the transformed ratio of expression of markers under CD3/28 or PMA stimulation conditions comparing IL-17+ cells to all live singlets. C-E: T cell subsets were gated manually and IL-17 (C) and IL-10 (D) expression quantified after stimulation with CD3/CD28 (C,D) or PMA (E). (n=4/group)

