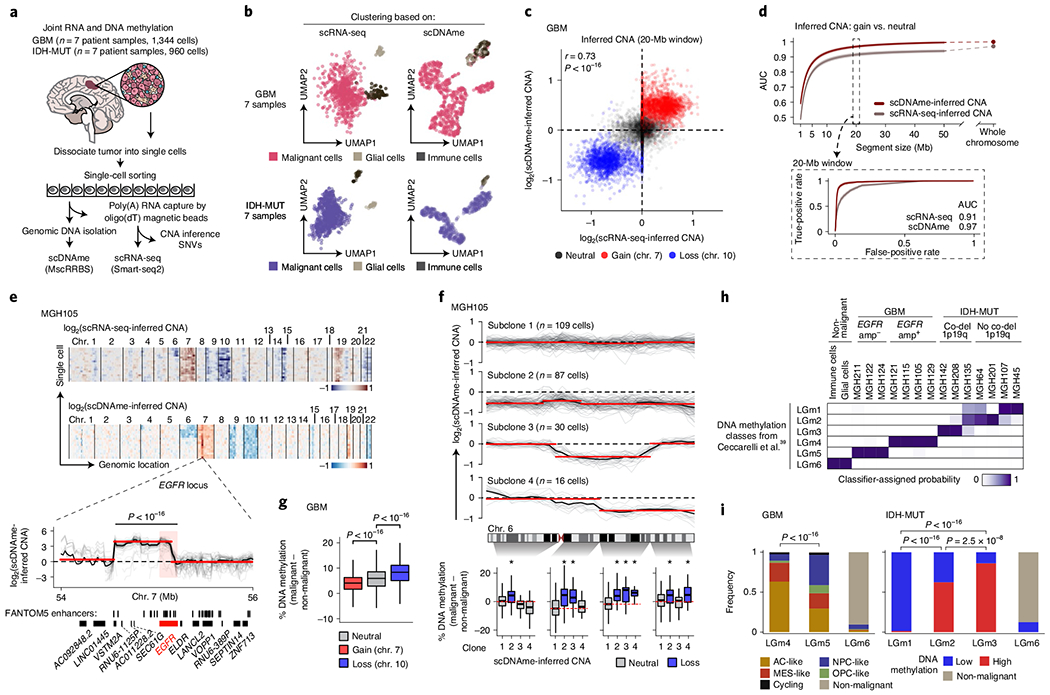
Fig. 1 |. Multiomics single-cell sequencing of primary human gliomas reveals intratumoral DNA methylation heterogeneity.

a, Joint methylomics and transcriptomics analysis applied to seven GBM and seven IDH-MUT glioma samples. b, UMAP plots of single cells that passed quality control based on data from scRNA-seq (left; GBM, n = 937; IDH-MUT, n = 809) or scDNAme (right; GBM, n = 867; IDH-MUT, n = 718). c, CNA inference by scDNAme (y axis) versus scRNA-seq (x axis) in 20-Mb windows. Pearson’s correlation coefficient is indicated. d, Performance of CNA inference by scDNAme (red line) and scRNA-seq (gray line) in correctly classifying regions of chromosome gain versus neutral regions, as assessed by the AUC of the receiver operating characteristic (ROC) curve at different genomic window resolutions. Inset, ROC curves at 20-Mb resolution. 95% confidence intervals were generated using bootstrapping. e, Top, representative example (MGH105) of CNA inference by scRNA-seq and scDNAme. Rows correspond to cells, clustered by overall CNA pattern. Bottom, CNA inference by scDNAme centered at the EGFR locus. CNA profiles for individual cells are shown in gray, with the mean per sample shown in black. Red lines represent CNA segments identified by circular binary segmentation analysis. f, Top, CNA inference by scDNAme at chromosome 6 showing distinct genetic subclones within the same tumor (MGH105). Color legend as in e. Bottom, CpG methylation changes at four regions of chromosome 6 when comparing the DNA methylation level of individual cells in each subclone to baseline. *P < 0.05. g, Percentage of CpG methylation change at regions with copy number gain (chromosome 7) or loss (chromosome 10) and neutral regions (chromosome 1) when comparing DNA methylation levels for individual GBM cells to baseline across all GBM samples. h, Heat map of probability assignment for pseudo-bulk DNA methylation profiles (based on MscRRBS) of malignant cells across all GBM and IDH-MUT glioma samples and non-malignant cells (defined in b) to previously described LGm classes39 based on a multinomial logistic regression classifier (Methods). Amp, amplification; co-del, co-deletion. i, Proportion of all single cells (defined in b) assigned to previously described DNA methylation LGm classes39. P values were determined by two-sided Mann–Whitney U test (e–g) or Fisher’s exact test (i). Boxplots represent the median and bottom and upper quartiles; whiskers correspond to 1.5 times the interquartile range.
