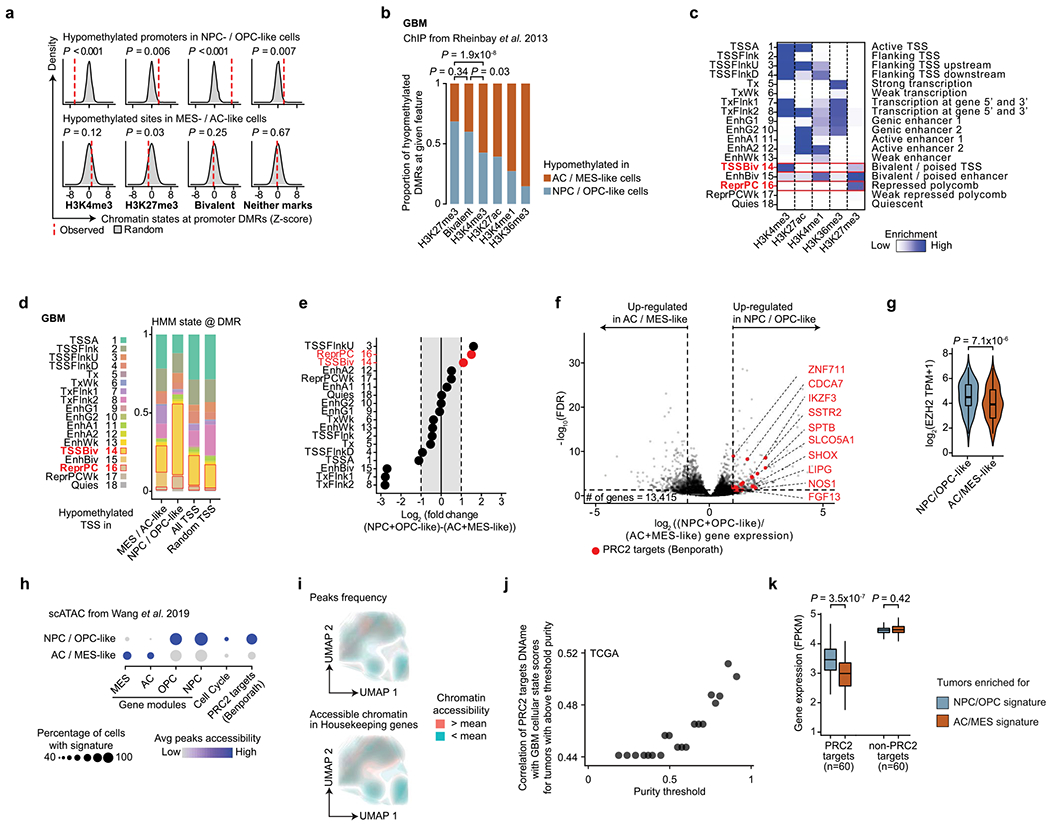
Extended Data Fig. 5 |. Validation of PRC2 hypomethylation in GBM stem-like states using histone marks, single-cell ATACseq and TCGA bulk data.

a, Proportion of chromatin states at randomly sampled promoters (1,000 random samplings) and hypomethylated promoters in GBM stem-like (top) vs. AC/MES-like (bottom) cells. b, Proportion of ChIP-seq peaks47 at hypomethylated promoters in GBM stem-like vs. AC/MES-like cells. c, Heatmap of emission parameters for a HMM 18-state model derived from GBM ChIP-seq maps47. Chromatin states of interest are highlighted in red. d, Proportion of chromatin states (see (c)) at hypomethylated promoters in GBM stem-like and AC/MES-like cells (Fig. 2c), all genes used in differential methylation promoter analysis (n = 15,218 genes), and randomly sampled promoters. e, Fold-change (log2) of chromatin states (see (c)) between hypomethylated promoters in GBM stem-like vs. AC/MES-like cells. Chromatin states of interest are highlighted in red. f, Differential gene expression between NPC/OPC-like (n = 270) and AC-/MES-like cells (n = 437). PRC2 target46 genes are highlighted. g, EZH2 expression (scRNAseq) between NPC-/OPC-like and MES-/AC-like cells across GBM samples. h, Gene expression activity derived from scATAC-seq open chromatin for GBM cellular states, cell cycle-related genes, and PRC2 targets46 at distinct NPC-/OPC-like and AC-/MES-like clusters identified based on scATACseq GBM data55. i, UMAP of scATACseq GBM data55 (sample SF11956) overlaid with density plot of peaks frequency (top) and chromatin accessibility of housekeeping genes1 (bottom). j, Spearman’s rank-order correlation between mean DNAme at promoters of PRC2 targets46 and RNA differentiation score and bulk sample purity for 67 TCGA GBM samples40,41. k, Mean gene expression of hypomethylated PRC2 targets in stem-like cells (n = 60; Fig. 2c) and randomly selected non-PRC2 targets (n = 60) in TCGA GBM samples40,41 enriched for NPC-/OPC-like vs. AC-/MES-like signature. P values were determined by permutation test (a), two-sided Fisher’s exact test (b), weighted F-test (f), two-sided Mann-Whitney U test (g, k). Boxplots represent the median, bottom and upper quartiles, whiskers correspond to 1.5 times the interquartile range.
