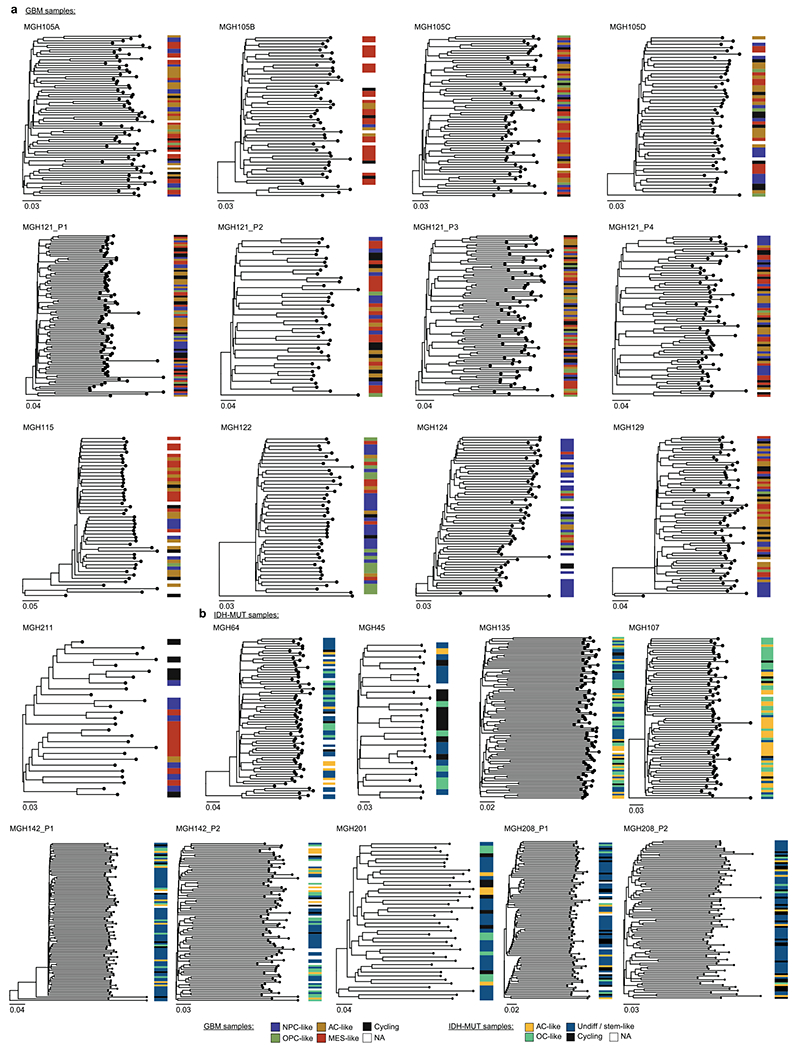
Extended Data Fig. 9 |. High-resolution DNAme-based lineage trees coupled with leaf annotation of cellular states.

a, Representative (random cell subsampling) DNAme-based lineage tree for each GBM patient sample (including MGH105 biological replicates and MGH121 technical replicates), with projection of GBM cellular states. b, Representative (random cell subsampling) DNAme-based lineage tree for each IDH-MUT patient sample (including MGH142 and MGH208 technical replicates), with projection of IDH-MUT cellular states. Throughout the figure, scale represents DNAme changes per site.
