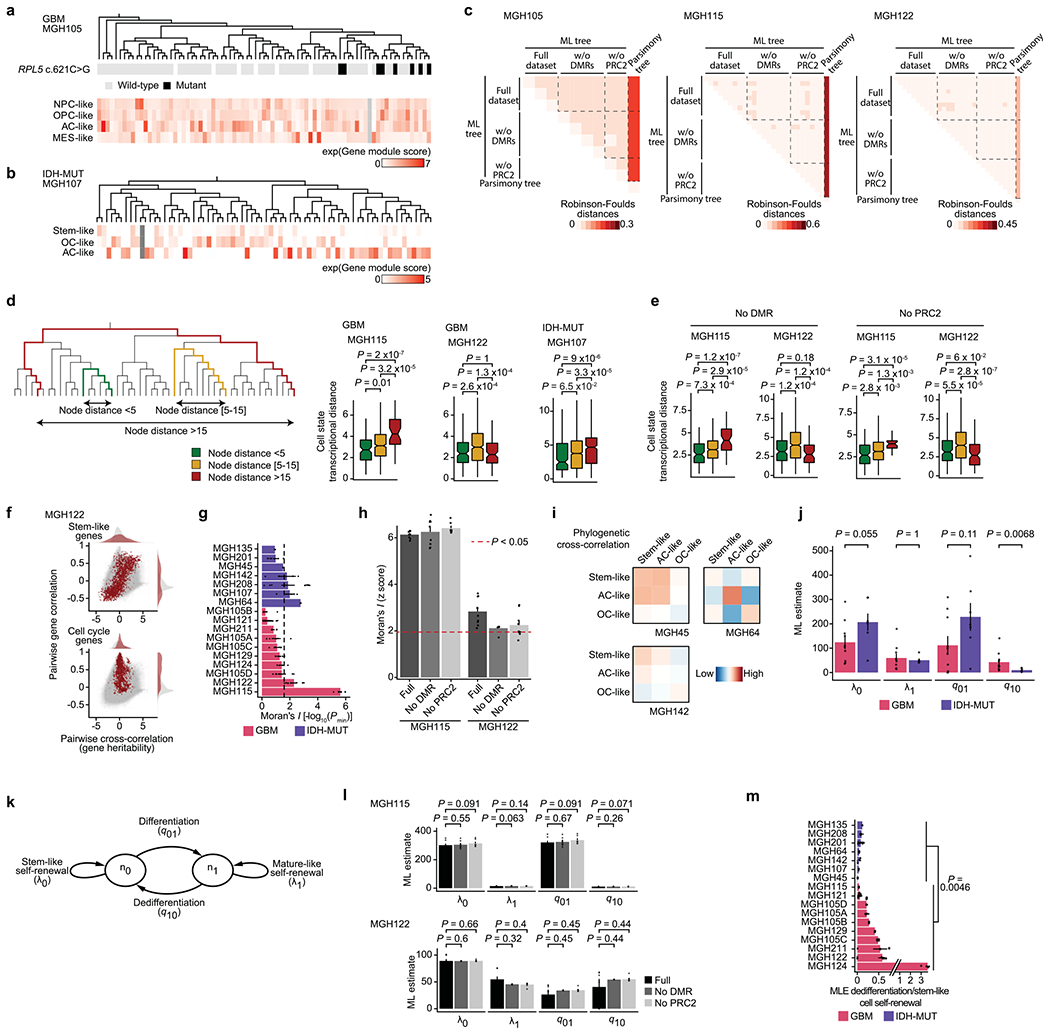
Extended Data Fig. 10 |. Cell state transition dynamics inference from lineage tree architectures revealed higher cellular plasticity in GBM compared to a more stable differentiation hierarchy in IDH-MUT.

a, Top: GBM DNAme-based lineage tree (MGH105) with RPL5 c.621 C>G genotyping. Bottom: GBM gene module scores. b, IDH-MUT DNAme-based lineage tree (MGH107) with IDH-MUT gene module scores. c, Normalized Robinson-Foulds between GBM tree replicates (from same sample; full dataset or removing CpGs from DMRs (Fig. 2c) or PRC2 targets46) reconstructed by maximum-likelihood (ML) vs. maximum parsimony. d, Transcriptional distances as function of lineage distance between unique cell pairs for MGH115, MGH122 and MGH107. e, As (d), for DNAme-based lineage tree of MGH115 and MGH122 (n=47 and 46 cells, respectively) reconstructed removing CpGs from DMRs (Fig. 2c) or PRC2 targets46. f, Pairwise gene expression correlation (Pearson’s) and cross-correlation (heritability). Grey points=all gene pair relationships; red points=gene pair relationships within selected gene module (top: stem-like; bottom: cell cycle). g, Phylogenetic association of cell states on GBM (n=7 patients; n=10 samples with MGH105A-D) and IDH-MUT (n=7 patients). Barplots=weighted mean±s.e.m. Moran’s I permutation-based one-sided P values (106 permutations) across replicates. Dashed line: P=0.025. h, As (g), comparing DNAme-based lineage tree reconstruction of MGH115 and MGH122, using replicates from same sample with full dataset or removing CpGs from DMRs (Fig. 2c) or PRC2 targets46. Barplots=mean±s.e.m. i, Heat maps of pairwise cell state phylogenetic associations. Close phylogenetic associations are shown in warmer colors. j, ML estimate (median±MAD across tree replicates; samples as in (g)) rates of cell state growth and transition. k, Mathematical model of glioma evolutionary dynamics. l, ML estimate (mean±s.e.m. across tree replicates of MGH115 and MGH122) rates of cell state self-renewal and transition, using replicates from same sample (full dataset or removing CpGs from DMRs analysis (Fig. 2c) or PRC2 targets46). m, Weighted median±weighted MAD rates of dedifferentiation compared to stem-like cell self-renewal across lineage tree replicates (sample as in (g)). P values: two-sided Mann-Whitney U test (d-e, j, l-m). Boxplots: median, bottom and upper quartiles, whiskers: 1.5 times the interquartile range.
