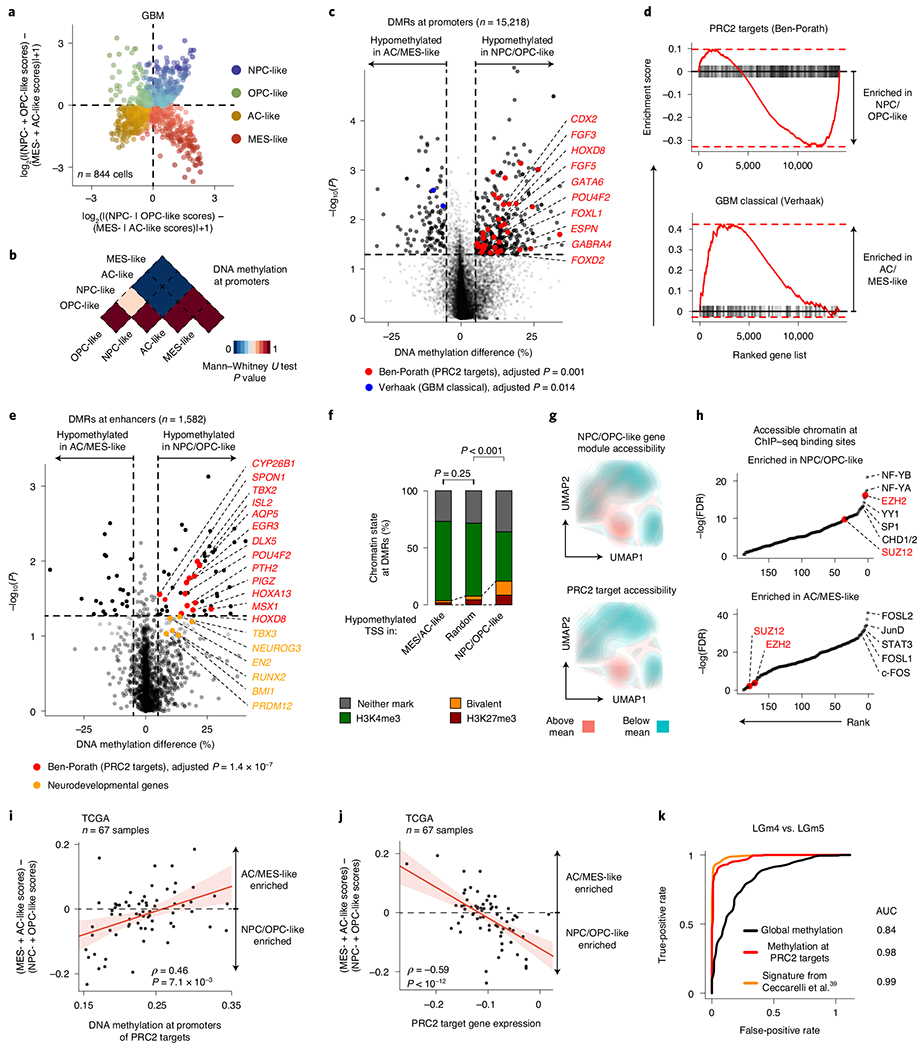
Fig. 2 |. PRC2 target DNA methylation is a key switch in the differentiation of malignant GBM cells.

a, Two-dimensional representation of cellular states across seven GBM samples (n = 844 malignant-only cells that passed scRNA-seq quality control). b, Heat map of P values obtained when comparing mean CpG methylation at promoters (TSS ± 1 kb) between GBM cellular states (n = 706, cells in a with matched scDNAme data). c, Volcano plot of differentially methylated promoters between the NPC/OPC-like and AC/MES-like GBM cellular states. Promoters (n = 459) with an absolute mean DNA methylation difference of greater than 5% and a P value below 0.05 were defined as differentially methylated. Genes correlated with the classical TCGA GBM subtype45 (blue) and genes corresponding to PRC2 targets46 (red) are highlighted (BH FDR-adjusted permutation-based P < 0.05). d, Enrichment score plots (reflecting whether a gene set is over-represented at the top or bottom of the ranked list of genes used in c; n = 15, 218 genes) for gene sets enriched at hypomethylated promoters in NPC/OPC-like (top) or AC/MES-like (bottom) cells. e, Volcano plot of differentially methylated enhancers in comparison of NPC/OPC-like and AC/MES-like GBM cellular states. Putative gene targets51 of hypomethylated enhancers in stem-like cells that are PRC2 targets46 are labeled in red. Key neurodevelopmental genes are highlighted in orange. f, Proportion of chromatin states at hypomethylated promoters in GBM AC/MES-like cells (defined in c), randomly sampled promoters (1,000 promoters sampled) and hypomethylated promoters in GBM stem-like cells (defined in c). g, UMAP plots of scATAC-seq GBM data55 (sample SF11956) overlaid with density plots showing chromatin accessibility of genes belonging to NPC/OPC-like gene modules (top) and PRC2 targets46 (bottom). h, Comparison of rank (by P value) in the enrichment of open chromatin at transcription factor-binding sites (n = 188) between NPC/OPC-like (top) and AC/MES-like (bottom) cells. PRC2 subunits are highlighted in red. i, Spearman’s rank-order correlation between mean DNA methylation at the promoters of PRC2 targets46 and RNA differentiation score (defined as the difference in gene module scores between AC/MES-like and NPC/OPC-like cellular states) for 67 TCGA GBM samples40,41. A linear regression line (red) with its 95% confidence interval is shown. j, Same as in i, for PRC2 target46 gene expression and RNA differentiation score. k, Comparison of performance, as assessed by ROC curve, in correctly classifying bulk TCGA GBM samples40,41 to DNA methylation glioma subtypes (LGm4 or LGm5)39 using 1,300 previously defined CpG sites39, mean global DNA methylation and mean PRC2 target46 DNA methylation. P values were determined by two-sided Mann-Whitney U test (b), generalized linear model (c,e), permutation test (f), BH FDR-adjusted hypergeometric test (h) or Spearman’s rank-order correlation (i,j).
