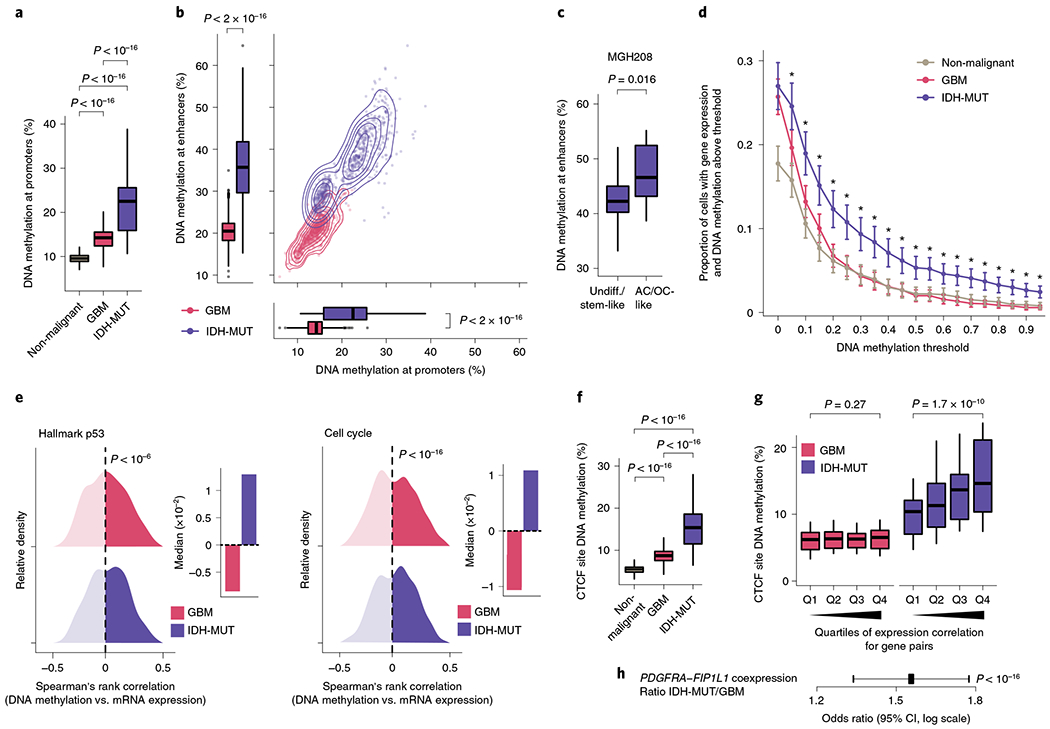
Fig. 3 |. Increased enhancer DNA methylation, decoupling of promoter methylation-expression relationship and disruption of CTCF insulation define the IDH-MUT epigenome.

a, Mean CpG methylation at promoters (TSS±1 kb) comparing non-malignant cells (n = 148) with GBM (n = 765) and IDH-MUT (n = 670) malignant cells. b, Mean CpG methylation at promoters versus FANTOM5 enhancers for GBM (n = 765) and IDH-MUT (n = 670) malignant cells. c, Mean CpG methylation at FANTOM5 enhancers for undifferentiated/stem-like and AC/OC-like IDH-MUT cells (MGH208; n = 123 cells with matched scRNA-seq and scDNAme data). d, Proportion of cells with gene expression (RNA read count > 0) and exhibiting above-threshold DNA methylation. Data are shown as mean±s.e.m. across all genes with sufficient RNA (expression seen in >5 cells) and DNA methylation (>5 CpGs per promoter) information across non-malignant cells (n = 148) and GBM (n = 765) and IDH-MUT (n = 670) malignant cells. *P < 0.05. e, Left plot, distribution of Spearman’s rho for correlation of expression with promoter DNA methylation (n = 1,523 genes expressed in >5 cells, DNA methylation at >5 CpGs per promoter) across GBM (n = 765) and IDH-MUT (n = 670) malignant cells. The distribution of Spearman’s rho values was compared to the distribution of values obtained with randomly permuted cell labels. Right plot, median values of Spearman’s rho for correlation of expression with promoter DNA methylation. See also Extended Data Fig. 8g. f, Mean CpG methylation at CTCF-binding sites comparing non-malignant cells (n = 148) with GBM (n = 765) and IDH-MUT (n = 670) malignant cells. g, Mean CpG methylation at CTCF-binding sites per quartile of gene expression correlation (Spearman’s rho) for previously defined pairs of neighboring genes separated by CTCF-binding sites70 in GBM (n = 765) and IDH-MUT (n = 670) malignant cells. h, The log odds ratio of PDGFRA-FIP1L1 gene pair coexpression (for both genes, RNA read count > 0) in IDH-MUT and GBM malignant cells. Error bar represents the 95% confidence interval (CI). P values were determined by two-sided Mann-Whitney U test (a–d,f,g; by comparing the proportion of cells with gene expression and exhibiting above-threshold DNA methylation in IDH-MUT and GBM cells at each DNA methylation threshold in d), two-sided Kolmogorov-Smirnov test (e) and Fisher’s exact test (h). Boxplots represent the median and bottom and upper quartiles; whiskers correspond to 1.5 times the interquartile range.
