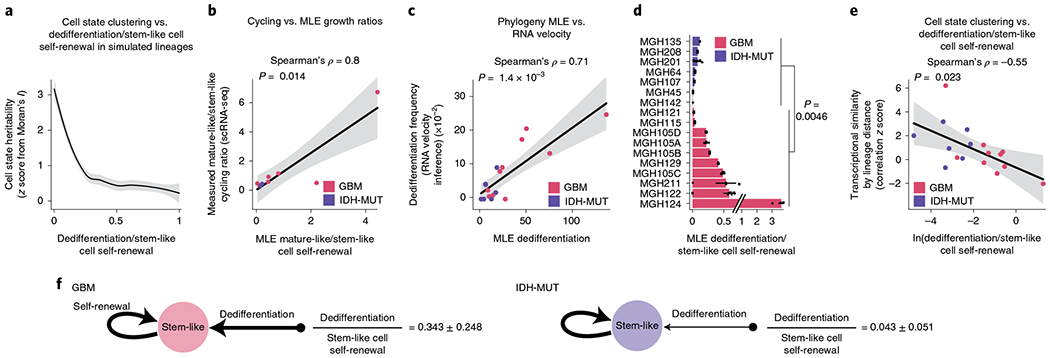
Fig. 5 |. GBMs exhibit higher cellular plasticity while IDH-MUT gliomas have a more stable differentiation hierarchy.

a, Simulated lineage trees (n = 1,000) with varying rates of dedifferentiation compared to stem-like cell self-renewal (x axis) as a function of phylogenetic association of cellular states (as measured by z scores from Moran’s I; y axis). The LOESS regression line (black) with its 95% confidence interval (gray) is shown. b, Comparison of the mathematical model’s estimates (MLE, maximum-likelihood estimation; weighted median across lineage tree replicates for each GBM (pink) and IDH-MUT (purple) sample) of cell state self-renewal in differentiated-like versus stem-like states with cycling rates derived from the scRNA-seq expression profiles. Spearman’s rho is indicated. Only samples with at least two cycling stem-like and two cycling differentiated-like cells were used (Methods). The linear regression line (black) with its 95% confidence interval (gray) is shown. c, Same as in b for comparison of the mathematical model’s estimates of dedifferentiation with dedifferentiation rates provided by RNA velocity estimation31 (Methods). The linear regression line (black) with its 95% confidence interval (gray) is shown. d, Rates of dedifferentiation compared to stem-like cell self-renewal (as estimated by mathematical modeling) in GBM (n = 7 patients; n = 10 if considering the four spatially distinct regions sampled from MGH105) and IDH-MUT (n = 7 patients) tumors across lineage tree replicates (Methods). Barplots represent median ± median absolute deviation (MAD) across lineage tree replicates. Medians are weighted to balance plates with a disparate number of lineage tree replicates within samples. e, Dedifferentiation/stem-like cell self-renewal ratio (weighted median across lineage tree replicates for each GBM (pink) and IDH-MUT (purple) sample; x axis) compared to cell state clustering on the lineage tree as measured by transcriptional similarity (mean across tree replicates of a gene module by lineage distance Pearson’s correlation z score; 1,000 permutations). The linear regression line (black) with its 95% confidence interval (gray) is shown. f, Data-driven model of cell state transition dynamics inferred from DNA methylation-based lineage trees. The median± MAD dedifferentiation/stem-like cell self-renewal ratios across GBM (n = 7 patients) and IDH-MUT (n = 7 patients) samples are shown. P values were determined by two-sided Mann–Whitney U test (d), comparing the weighted median dedifferentiation/stem-like cell self-renewal ratio of GBM samples with the weighted median dedifferentiation/stem-like cell self-renewal ratio of IDH-MUT samples.
